Linkage & Linkage Disequilibrium
S. Purcell
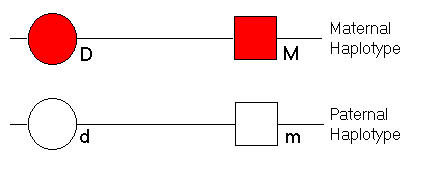
 ObjectiveThis module aims to demonstrate the related phenomena of linkage and linkage disequilibrium (allelic association) between two loci.TutorialIn the module, an individual is represented as follows:
 We specify the recombination fraction between the disease
locus and the marker locus. This represents the probability of
a cross-over occurring between the two loci during
meioses.
If there is no recombination then the parent would transmit either:
 SimulationIn the simulation we take one individual who has inherited :
 In this case, the parent has inherited both the red allele at
the disease locus and the red marker allele from her mother
(as it is on the left hand-side).
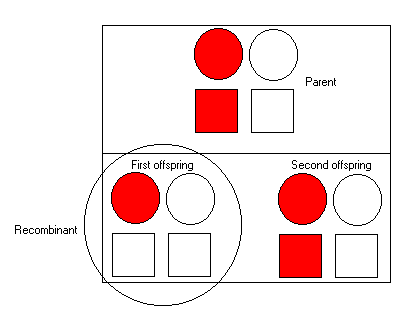
To her first offspring, we see that she transmits the red allele
at the disease locus but not at the marker allele - so we can infer
a recombination event occurred during meioses. We represent this by
placing a circle around the child.
The second offspring has inherited the red allele at both the disease
locus and the marker, and so is not a recombinant.
In both cases, the offspring have also received a haplotype from their
fathers of course. These are the right hand side symbols (note: as
mentioned, the fathers are not represented in this simulation).
In this simple simulation, we assume that both at the marker
and the disease locus, both red and white alleles have
a 50:50 frequency. We also assume that fathers are equally likely
to transmit any of the four disease-marker haplotypes.
Linkage & Linkage DisequilibriumLinkage If were able to observe this entire pedigree and track the transmission of disease and marker alleles with 100% accuracy, the calculation of the recombination fraction is simply the proportion of recombinants versus non-recombinants. In general, linkage arises solely from the genetic distance between two loci, and is estimated by inferring the amount of recombination between two loci. As such, it is not a function of the frequencies of any specific alleles. Indeed, even for regions of the genome without any variation, there will still be linkage resulting from the relationship between genetic distance and recombination. The only difference is that we would never be able to detect it (for it would be impossible to assign a parental origin to any allele). Linkage Disequilibrium In contrast, linkage disequilibrium describes a correlation between specific alleles at two loci in a population sample. This can arise due to the fact that apparently unrelated individuals are infact likely to have distant relatives. Two loci that are very tightly linked and therefore unlikely to be separated by recombination may quite possibly be transmitted together from distant ancestors to apparently unrelated individuals. This will induce a correlation between alleles at the two loci. (Hopefully!) the demonstration will demonstrate this phenomenon. Unlike linkage, linkage disequilibrium also depends on other factors such as allele frequency and how old the polymorphism is in terms of generations. Linkage disequilibrium (i.e. correlations between alleles at different loci) can occur for reasons other than tight linkage however. For instance, ethnic stratification can easily cause correlations between alleles at different loci. Imagine we observed the following allele counts for Europeans and Asians had the following allele frequencies for two loci :
200 European individuals (i.e. 400 alleles)
           |          Locus A
   Locus B |         A          a |     Total
-----------+----------------------+----------
         B |       160        160 |       320
         b |        40         40 |        80
-----------+----------------------+----------
     Total |       200        200 |       400
          Pearson chi2(1) =   0.0000   Pr = 1.000


200 Asian individuals (i.e. 400 alleles)
           |          Locus A
   Locus B |         A          a |     Total
-----------+----------------------+----------
         B |       160         40 |       200
         b |       160         40 |       200
-----------+----------------------+----------
     Total |       320         80 |       400
          Pearson chi2(1) =   0.0000   Pr = 1.000
If we analyse the two samples together, however,
we find evidence of an association:
400 European and Asian individuals (i.e. 800 alleles)
           |          Locus A
   Locus B |         A          a |     Total
-----------+----------------------+----------
         B |       320        200 |       520
         b |       200         80 |       280
-----------+----------------------+----------
     Total |        520       280 |       800
          Pearson chi2(1) =   7.8251   Pr = 0.005
The measure of linkage disequilibrium we use in this
demonstration is the simple chi-squared for a 2-by-2
table.
Summary
Site created S.Purcell, last updated 7.10.2000 |