Maximum Likelihood Estimation (MLE)
 Model-fittingNow we are in a position to introduce the concept of likelihood. If the probability of an event X dependent on model parameters p is writtenP ( X | p )then we would talk about the likelihood L ( p | X )that is, the likelihood of the parameters given the data. For most sensible models, we will find that certain data are more probable than other data. The aim of maximum likelihood estimation is to find the parameter value(s) that makes the observed data most likely. This is because the likelihood of the parameters given the data is defined to be equal to the probability of the data given the parameters (nb. technically, they are proportional to each other, but this does not affect the principle). If we were in the business of making predictions based on a set of solid assumptions, then we would be interested in probabilities - the probability of certain outcomes occurring or not occurring. However, in the case of data analysis, we have already observed all the data: once they have been observed they are fixed, there is no 'probabilistic' part to them anymore (the word data comes from the Latin word meaning 'given'). We are much more interested in the likelihood of the model parameters that underly the fixed data. Probability Knowing parameters -> Prediction of outcome Likelihood Observation of data -> Estimation of parameters A simple example of MLETo re-iterate, the simple principle of maximum likelihood parameter estimation is this: find the parameter values that make the observed data most likely. How would we go about this in a simple coin toss experiment? That is, rather than assume that p is a certain value (0.5) we might wish to find the maximum likelihood estimate (MLE) of p, given a specific dataset. Beyond parameter estimation, the likelihood framework allows us to make tests of parameter values. For example, we might want to ask whether or not the estimated p differs significantly from 0.5 or not. This test is essentially asking: is there evidence that the coin is biased? We will see how such tests can be performed when we introduce the concept of a likelihood ratio test below. Say we toss a coin 100 times and observe 56 heads and 44 tails. Instead of assuming that p is 0.5, we want to find the MLE for p. Then we want to ask whether or not this value differs significantly from 0.50. How do we do this? We find the value for p that makes the observed data most likely. As mentioned, the observed data are now fixed. They will be constants that are plugged into our binomial probability model :-


                  p       L
                  --------------
                  0.48    0.0222
                  0.50    0.0389
                  0.52    0.0581
                  0.54    0.0739
                  0.56    0.0801
                  0.58    0.0738
                  0.60    0.0576
                  0.62    0.0378
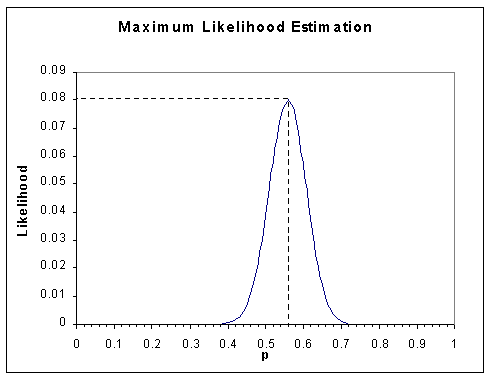
If we graph these data across the full range of possible values for
p we see the following likelihood surface.

 Return to front page Site created by S.Purcell, last updated 21.09.2000 |