Maximum Likelihood Estimation (MLE)
 MLE analysis of linkage dataIf we have a sample in which the number of recombinants and non- recombinants for two specific loci can be counted, then we can estimate the recombination fraction between between those two loci. The test for linkage is simply the test of whether the recombination fraction ( ) is 0.5 (the null hypothesis of no linkage) or less than 0.5
(the alternative hypothesis of linkage).
You might have noticed a striking similarity to the coin-flipping
example here. The good news is that the analysis is virtually identical.
Note that, in real life, we would
not expect to observe fully informative gametes for all pedigrees,
and more complex methods have to fill in the gaps, but the principles
are much the same.
Suppose that we observe N fully informative gametes, of which
R are recombinants. How do we test for linkage and estimate
the recombination fraction,
 ?
Since each gamete has probability
 of being recombinant and probability (1-
 ) of being non-recombinant, the likelihood function is


 =0.5, so the value of the log-likelihood function is

 is simply the proportion of recombinant gametes


 and the log-likelihood at
 =0.5 to be the "lod-score" at that value of
 . The maximum lod-score occurs at the MLE of
 : its value is equal to the likelihood ratio statistic divided
by a factor of 2ln10 (approximately 4.6).
An Example
Suppose that between two loci we observe
27 / 139 = 0.1942
The log-likelihood at the MLE of the recombination fraction is
    ln LA = 27 * ln(0.1942) + (139 - 27) * ln(1-0.1942)
       = -68.43
whereas under the null of no linkage it is
    ln L0 = 139 * ln(0.5)
       = -96.35
This gives a value of
    2(LA - L0) = 2 * -68.43 - (-96.35)
                      = 55.84
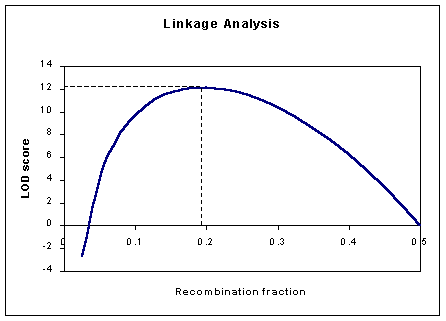
This is clearly highly significant, corresponding to a lod-score of
approximately
   LOD = 55.84 / 4.6
       = 12.1
We can plot the lod-score curve for different values of
 :
:

 Return to front page Site created by S.Purcell, last updated 21.09.2000 |