- Stable download
- Development code
- General notes
- MS-DOS notes
- Unix/Linux notes
- Compilation
- Using the command line
- Viewing output files
- Version history
- Running PLINK
- PED files
- MAP files
- Transposed filesets
- Long-format filesets
- Binary PED files
- Alternate phenotypes
- Covariate files
- Cluster files
- Set files
- Recode
- Reorder
- Write SNP list
- Update SNP map
- Update allele information
- Force reference allele
- Update individuals
- Write covariate files
- Write cluster files
- Flip strand
- Scan for strand problem
- Merge two files
- Merge multiple files
- Extract SNPs
- Remove SNPs
- Zero out sets of genotypes
- Extract Individuals
- Remove Individuals
- Filter Individuals
- Attribute filters
- Create a set file
- Tabulate SNPs by sets
- SNP quality scores
- Genotypic quality scores
- Missingness
- Obligatory missingness
- IBM clustering
- Missingness by phenotype
- Missingness by genotype
- Hardy-Weinberg
- Allele frequencies
- LD-based SNP pruning
- Mendel errors
- Sex check
- Pedigree errors
- IBS clustering
- Permutation test
- Clustering options
- IBS matrix
- Multidimensional scaling
- Outlier detection
- Case/control
- Fisher's exact
- Full model
- Stratified analysis
- Tests of heterogeneity
- Hotelling's T(2) test
- Quantitative trait
- Quantitative trait means
- Quantitative trait GxE
- Linear and logistic models
- Set-based tests
- Multiple-test correction
- Basic permutation
- Adaptive permutation
- max(T) permutation
- Ranked permutation
- Gene-dropping
- Within-cluster
- Permuted phenotypes files
- Imputing haplotypes
- Precomputed lists
- Haplotype frequencies
- Haplotype-based association
- Haplotype-based GLM tests
- Haplotype-based TDT
- Haplotype imputation
- Individual phases
- Making reference set
- Basic association test
- Modifying parameters
- Imputing discrete calls
- Verbose output options
- File format
- MAP file construction
- Loading CNVs
- Check for overlap
- Filter on type
- Filter on genes
- Filter on frequency
- Burden analysis
- Geneset enrichment
- Mapping loci
- Regional tests
- Quantitative traits
- Write CNV lists
- Write gene lists
- Grouping CNVs
- Overview/example
- Basic usage
- Consistency checks
- Aliases
- Joint IDs
- Lookups
- Replace values
- Match files
- Quick match files
- Misc.
- HapMap (PLINK format)
- Teaching materials
- Multimarker tests
- Gene-set lists
- Gene range lists
- SNP attributes
A PLINK tutorial
In this tutorial, we will consider using PLINK to analyse example data: randomly selected genotypes (approximately 80,000 autosomal SNPs) from the 89 Asian HapMap individuals. A phenotype has been simulated based on the genotype at one SNP. In this tutorial, we will walk through using PLINK to work with the data, using a range of features: data management, summary statistics, population stratification and basic association analysis. NOTE These data do not, of course, represent a realistic study design or a realistic disease model. The point of this exercise is simply to get used to running PLINK.89 HapMap samples and 80K random SNPs
The first step is to obtain a working copy of PLINK and of the example data files.- Make sure you have PLINK installed on your machine (see these instructions).
- Download the example data archive file which contains the genotypes, map files and two extra phenotype files, described below (zipped, approximately 2.8M)
- Create a new folder/directory on your machine, and unzip the file you downloaded (called hapmap1.zip) into this folder.
Two phenotypes were generated: a quantitative triat and a disease trait (affection status, coded 1=unaffected, 2=affected), based on a median split of the quantitative trait. The quantitative trait was generated as a function of three simple components:
- A random component
- Chinese versus Japanese identity
- A variant on chromosome 2, rs2222162
          Chinese   Japanese
Control      34        11
Case         11        33
which shows a strong relationship between these two variables. The next
table shows the association between the variant rs2222162 and
disease:
             Genotype
             11      12      22
Control      17      22      6
Case         3       19      22
Again, the strong association is clear. Note that the alleles have been
recoded as 1 and 2 (this is not necessary for
PLINK to work, however -- it can accept any coding for SNPs).
In summary, we have a single causal variant that is associated with
disease. Complicating factors are that this variant is one of
83534 SNPs and also that there might be some degree of confounding
of the SNP-disease associations due to the subpopulation-disease
association -- i.e. a possibility that population stratification effects
will exist. Even though we might expect the two subpopulations to be
fairly similar from an overall genetic perspective, and even though the
sample size is small, this might still lead to an increase in false
positive rates if not controlled for.
We will use the affection status variable as the default variable for
analysis (i.e. the sixth column in the PED file). The quantitative
trait is in a separate alternate phenotype file, qt.phe. The
file pop.phe contains a dummy phenotype that is coded 1 for
Chinese individuals and 2 for Japanese individuals. We will use this
in investigating between-population differences. You can view these
alternate phenotype files in any text editor.
In this tutorial dataset we focus on autosomal SNPs for simplicity,
although PLINK does provide support for X and Y chromosome
SNPs for a number of analyses. See the main documentation for further
information.
Using PLINK to analyse these data
This tutorial is intended to introduce some of PLINK's features rather than provide exhaustive coverage of them. Futhermore, it is not intended as an analysis plan for whole genome data, or to represent anything close to 'best practice'. These hyperlinks show an overview of topics:- Getting started
- Making a binary PED file
- Working with the binary PED file
- Summary statistics: missing rates
- Summary statistics: allele frequencies
- Basic association analysis
- Genotypic association models
- Stratification analysis
- Association analysis, accounting for clusters
- Quantitative trait association analysis
- Extracting a SNP of interest
plink --file hapmap1
The --file option takes a single parameter, the root of the input file names, and will look for two files: a PED file and a MAP file with this root name. In otherwords, --file hapmap1 implies hapmap1.ped and hapmap1.map should exist in the current directory. HINT! It is possible to specify files outside of the current directory, and to have the PED and MAP files have different root names, or not end in .ped and .map, by using the --ped and --map options. PED and MAP files are plain text files; PED files contain genotype information (one person per row) and MAP files contain information on the name and position of the markers in the PED file. If you are not familiar with the file formats required for PED and MAP files, please consult this page. The above command should generate something like the following output in the console window. It will also save this information to a file called plink.log.
     @----------------------------------------------------------@
     |         PLINK!       |    v0.99l     |   27/Jul/2006     |
     |----------------------------------------------------------|
     |  (C) 2006 Shaun Purcell, GNU General Public License, v2  |
     |----------------------------------------------------------|
     |       http://pngu.mgh.harvard.edu/purcell/plink/         |
     @----------------------------------------------------------@

     Web-based version check ( --noweb to skip )
     Connecting to web...  OK, v0.99l is current

     *** Pre-Release Testing Version ***

     Writing this text to log file [ plink.log ]
     Analysis started: Mon Jul 31 09:00:11 2006

     Options in effect:
        --file hapmap1

     83534 (of 83534) markers to be included from [ hapmap1.map ]
     89 individuals read from [ hapmap1.ped ]
     89 individuals with nonmissing phenotypes
     Assuming a binary trait (1=unaff, 2=aff, 0=miss)
     Missing phenotype value is also -9
     Before frequency and genotyping pruning, there are 83534 SNPs
     Applying filters (SNP-major mode)
     89 founders and 0 non-founders found
     0 of 89 individuals removed for low genotyping ( MIND > 0.1 )
     859 SNPs failed missingness test ( GENO > 0.1 )
     16994 SNPs failed frequency test ( MAF < 0.01 )
     After frequency and genotyping pruning, there are 65803 SNPs
     Analysis finished: Mon Jul 31 09:00:19 2006
The information contained here can be summarized as follows:
- A banner showing copyright information and the version number -- the web-based version check shows that this is an up-to-date version of PLINK and displays a message that v0.99l is a pre-release testing version.
- A message indicating that the log file will be saved in plink.log. The name of the output file can be changed with the --out option -- e.g. specifying --out anal1 will generate a log file called anal1.log instead.
- A list of the command options specified is given next: in this case it is only a single option, --file hapmap1. By keeping track of log files, and naming each analysis with its own --out name, it makes it easier to keep track of when and how the different output files were generated.
- Next is some information on the number of markers and individuals read from the MAP and PED file. In total, just over 80,000 SNPs were read in from the MAP file. It is written "...83534 (of 83534)..." because some SNPs might be excluded (by making the physical position a negative number in the MAP file), in which case the first number would indicate how many SNPs are included. In this case, all SNPs are read in from the PED file. We also see that 89 individuals were read in from the PED file, and that all these individuals had valid phenotype information.
- Next, PLINK tells us that the phenotype is an affection status variable, as opposed to a quantitative trait, and lets us know what the missing values are.
- The next stage is the filtering stage -- individuals and/or SNPs are removed on the basis of thresholds. Please see this page for more information on setting thresholds. In this case we see that no individuals were removed, but almost 20,000 SNPs were removed, based on missingness (859) and frequency (16994). This particularly high proportion of removed SNPs is based on the fact that these are random HapMap SNPs in the Chinese and Japanese samples, rather than pre-selected markers on a whole-genome association product: there will be many more rare and monomorphic markers here than one would normally expect.
- Finally, a line is given that indicates when this analysis finished. You can see that it took 8 seconds (on my machine at least) to read in the file and apply the filters.
plink --file hapmap1 --make-bed --out hapmap1
If it runs correctly on your machine, you should see the following in your output:
     above as before
     ...
     Before frequency and genotyping pruning, there are 83534 SNPs
     Applying filters (SNP-major mode)
     89 founders and 0 non-founders found
     0 SNPs failed missingness test ( GENO > 1 )
     0 SNPs failed frequency test ( MAF < 0 )
     After frequency and genotyping pruning, there are 83534 SNPs
     Writing pedigree information to [ hapmap1.fam ]
     Writing map (extended format) information to [ hapmap1.bim ]
     Writing genotype bitfile to [ hapmap1.bed ]
     Using (default) SNP-major mode
     Analysis finished: Mon Jul 31 09:10:05 2006
There are several things to note:
- When using the --make-bed option, the threshold filters for missing rates and allele frequency were automatically set to exclude nobody. Although these filters can be specified manually (using --mind, --geno and --maf) to exclude people, this default tends to be wanted when creating a new PED or binary PED file. The commands --extract / --exclude and --keep / --remove can also be applied at this stage.
- Three files are created with this command -- the binary file that contains the raw genotype data hapmap1.bed but also a revsied map file hapmap1.bim which contains two extra columns that give the allele names for each SNP, and hapmap1.fam which is just the first six columns of hapmap1.ped. You can view the .bim and .fam files -- but do not try to view the .bed file. None of these three files should be manually editted.
plink --file hapmap1 --make-bed --mind 0.05 --out highgeno
which would create files
     highgeno.bed
     highgeno.bim
     highgeno.fam
Working with the binary PED file
To specify that the input data are in binary format, as opposed to the
normal text PED/MAP format, just use the --bfile option instead
of --file. To repeat the first command we ran (which just loads
the data and prints some basic summary statistics):
plink --bfile hapmap1
     Writing this text to log file [ plink.log ]
     Analysis started: Mon Jul 31 09:12:08 2006

     Options in effect:
             --bfile hapmap1

     Reading map (extended format) from [ hapmap1.bim ]
     83534 markers to be included from [ hapmap1.bim ]
     Reading pedigree information from [ hapmap1.fam ]
     89 individuals read from [ hapmap1.fam ]
     89 individuals with nonmissing phenotypes
     Reading genotype bitfile from [ hapmap1.bed ]
     Detected that binary PED file is v1.00 SNP-major mode
     Before frequency and genotyping pruning, there are 83534 SNPs
     Applying filters (SNP-major mode)
     89 founders and 0 non-founders found
     0 of 89 individuals removed for low genotyping ( MIND > 0.1 )
     859 SNPs failed missingness test ( GENO > 0.1 )
     16994 SNPs failed frequency test ( MAF < 0.01 )
     After frequency and genotyping pruning, there are 65803 SNPs
     Analysis finished: Mon Jul 31 09:12:10 2006
The things to note here:
- That three files hapmap1.bim, hapmap1.fam and hapmap1.bed were loaded instead of the usual two files. That is, hapmap1.ped and hapmap1.map are not used in this analysis, and could in fact be deleted now.
- The data are loaded in much more quickly -- based on the timestamp at the beginning and end of the log output, this took 2 seconds instead of 10.
plink --bfile hapmap1 --missing --out miss_stat
which should generate the following output:
     ...
     0 of 89 individuals removed for low genotyping ( MIND > 0.1 )
     Writing individual missingness information to [ miss_stat.imiss ]
     Writing locus missingness information to [ miss_stat.lmiss ]
     ...
Here we see that no individuals were removed for low genotypes (MIND >
0.1 implies that we accept people with less than 10 percent missingness).
The per individual and per SNP (after excluding individuals on the basis of
low genotyping) rates are then output to the files miss_stat.imiss
and miss_stat.lmiss respectively. If we had not specified an
--out option, the root output filename would have defaulted to "plink".
These output files are standard, plain text files that can be viewed in
any text editor, pager, spreadsheet or statistics package (albeit one
that can handle large files). Taking a look at the file
miss_stat.lmiss, for example using the more command which is
present on most systems:
more miss_stat.lmiss
we see
      CHR          SNP   N_MISS     F_MISS
        1    rs6681049        0          0
        1    rs4074137        0          0
        1    rs7540009        0          0
        1    rs1891905        0          0
        1    rs9729550        0          0
        1    rs3813196        0          0
        1    rs6704013        2  0.0224719
        1     rs307347       12   0.134831
        1    rs9439440        2  0.0224719
      ...
That is, for each SNP, we see the number of missing individuals
(N_MISS) and the proportion of individuals missing
(F_MISS). Similarly:
more miss_stat.imiss
we see
         FID          IID MISS_PHENO     N_MISS     F_MISS
      HCB181            1          N        671 0.00803266
      HCB182            1          N       1156  0.0138387
      HCB183            1          N        498 0.00596164
      HCB184            1          N        412 0.00493212
      HCB185            1          N        329 0.00393852
      HCB186            1          N       1233  0.0147605
      HCB187            1          N        258 0.00308856
      ...
The final column is the actual genotyping rate for that individual -- we
see the genotyping rate is very high here.
HINT If you are using a spreadsheet package that can only
display a limited number of rows (some popular packages can handle just over
65,000 rows) then it might be desirable to ask PLINK to analyse the data by
chromosome, using the --chr option. For example, to perform the above
analysis for chromosome 1:
plink --bfile hapmap1 --chr 1 --out res1 --missing
then for chromosome 2:plink --bfile hapmap1 --chr 2 --out res2 --missing
and so on. Summary statistics: allele frequencies Next we perform a similar analysis, except requesting allele frequencies instead of genotyping rates. The following command generates a file called freq_stat.frq which contains the minor allele frequency and allele codes for each SNP.plink --bfile hapmap1 --freq --out freq_stat
It is also possible to perform this frequency analysis (and the missingness analysis) stratified by a categorical, cluster variable. In this case, we shall use the file that indicates whether the individual is from the Chinese or the Japanese sample, pop.phe. This cluster file contains three columns; each row is an individual. The format is described more fully in the main documentation. To perform a stratified analysis, use the --within option.plink --bfile hapmap1 --freq --within pop.phe --out freq_stat
The output will now indicate that a file called freq_stat.frq.strat. has been generated instead of freq_stat.frq. If we view this file:more freq_stat.frq.strat
we see each row is now the allele frequency for each SNP stratifed by subpopulation:
     CHR          SNP     CLST   A1   A2          MAF
       1    rs6681049        1    1    2     0.233333
       1    rs6681049        2    1    2     0.193182
       1    rs4074137        1    1    2          0.1
       1    rs4074137        2    1    2    0.0568182
       1    rs7540009        1    0    2            0
       1    rs7540009        2    0    2            0
       1    rs1891905        1    1    2     0.411111
       1    rs1891905        2    1    2     0.397727
       ...
Here we see that each SNP is represented twice - the CLST
column indicates whether the frequency is from the Chinese or Japanese
populations, coded as per the pop.phe file.
If you were just interested in a specific SNP, and wanted to know what
the frequency was in the two populations, you can use the --snp
option to select this SNP:
plink --bfile hapmap1 --snp rs1891905 --freq --within pop.phe --out snp1_frq_stat
would generate a file snp1_frq_stat.frq.strat containing only the population-specific frequencies for this single SNP. You can also specify a range of SNPs by adding the --window kb option or using the options --from and --to, following each with a different SNP (they must be in the correct order and be on the same chromosome). Follow this link for more details. Basic association analysis Let's now perform a basic association analysis on the disease trait for all single SNPs. The basic command isplink --bfile hapmap1 --assoc --out as1
which generates an output file as1.assoc which contains the following fields
      CHR          SNP   A1      F_A      F_U   A2        CHISQ            P           OR
        1    rs6681049    1   0.1591   0.2667    2        3.067      0.07991       0.5203
        1    rs4074137    1  0.07955  0.07778    2     0.001919       0.9651        1.025
        1    rs1891905    1   0.4091      0.4    2      0.01527       0.9017        1.038
        1    rs9729550    1   0.1705  0.08889    2        2.631       0.1048        2.106
        1    rs3813196    1  0.03409  0.02222    2       0.2296       0.6318        1.553
        1   rs12044597    1      0.5   0.4889    2      0.02198       0.8822        1.045
        1   rs10907185    1   0.3068   0.2667    2       0.3509       0.5536        1.217
        1   rs11260616    1   0.2326      0.2    2       0.2754       0.5998        1.212
        1     rs745910    1   0.1395   0.1932    2       0.9013       0.3424       0.6773
     ...
where each row is a single SNP association result. The fields are:
- Chromosome
- SNP identifier
- Code for allele 1 (the minor, rare allele based on the entire sample frequencies)
- The frequency of this variant in cases
- The frequency of this variant in controls
- Code for the other allele
- The chi-squared statistic for this test (1 df)
- The asymptotic significance value for this test
- The odds ratio for this test
sort --key=7 -nr as1.assoc | head
would give
       13    rs9585021    1    0.625   0.2841    2        20.62    5.586e-06          4.2
        2    rs2222162    1   0.2841   0.6222    2        20.51    5.918e-06       0.2409
        9   rs10810856    1   0.2955  0.04444    2        20.01    7.723e-06        9.016
        2    rs4675607    1   0.1628   0.4778    2        19.93     8.05e-06       0.2125
        2    rs4673349    1   0.1818      0.5    2        19.83    8.485e-06       0.2222
        2    rs1375352    1   0.1818      0.5    2        19.83    8.485e-06       0.2222
       21     rs219746    1      0.5   0.1889    2        19.12    1.228e-05        4.294
        1    rs4078404    2      0.5      0.2    1        17.64    2.667e-05            4
       14    rs1152431    2   0.2727   0.5795    1        16.94    3.862e-05       0.2721
       14    rs4899962    2   0.3023   0.6111    1        16.88    3.983e-05       0.2758
Here we see that the simulated disease variant rs2222162 is
actually the second most significant SNP in the list, with a large
difference in allele frequencies of 0.28 in cases versus 0.62 in
controls. However, we also see that, just by chance, a second SNP on
chromosome 13 shows a slightly higher test result, with coincidentally
similar allele frequencies in cases and controls. (Whether this result is
due to chance alone or perhaps represents some confounding due to the
population structure in this sample, we will investigate below). This
highlights the important point that when performing so many tests,
particularly in a small sample, we often expect
the distribution of true positive results to be virtually
indistinguishable from the best false positive results. That our variant
appears in the top ten list is reassuring however.
To get a sorted list of association results, that also includes a range of significance
values that are adjusted for multiple testing, use the --adjust flag:
plink --bfile hapmap1 --assoc --adjust --out as2
This generates the file as2.assoc.adjust in addition to the basic as2.assoc output file. Using more, one can easily look at one's most significant associations:more as2.assoc.adjusted
 CHR          SNP      UNADJ         GC     BONF     HOLM  SIDAK_SS  SIDAK_SD    FDR_BH  FDR_BY
  13    rs9585021  5.586e-06  3.076e-05   0.3676   0.3676    0.3076    0.3076   0.09306       1
   2    rs2222162  5.918e-06  3.231e-05   0.3894   0.3894    0.3226    0.3226   0.09306       1
   9   rs10810856  7.723e-06  4.049e-05   0.5082   0.5082    0.3984    0.3984   0.09306       1
   2    rs4675607   8.05e-06  4.195e-05   0.5297   0.5297    0.4112    0.4112   0.09306       1
   2    rs1375352  8.485e-06  4.386e-05   0.5584   0.5583    0.4279    0.4278   0.09306       1
   2    rs4673349  8.485e-06  4.386e-05   0.5584   0.5583    0.4279    0.4278   0.09306       1
  21     rs219746  1.228e-05  6.003e-05   0.8083   0.8082    0.5544    0.5543    0.1155       1
   1    rs4078404  2.667e-05  0.0001159        1        1    0.8271     0.827    0.2194       1
  14    rs1152431  3.862e-05  0.0001588        1        1    0.9213    0.9212    0.2621       1
  14    rs4899962  3.983e-05   0.000163        1        1    0.9273    0.9272    0.2621       1
   8    rs2470048  4.487e-05  0.0001804        1        1    0.9478    0.9478    0.2684       1
Here we see a pre-sorted list of association results. The fields are as follows:
- Chromosome
- SNP identifier
- Unadjusted, asymptotic significance value
- Genomic control adjusted significance value. This is based on a simple estimation of the inflation factor based on median chi-square statistic. These values do not control for multiple testing therefore.
- Bonferroni adjusted significance value
- Holm step-down adjusted significance value
- Sidak single-step adjusted significance value
- Sidak step-down adjusted significance value
- Benjamini & Hochberg (1995) step-up FDR control
- Benjamini & Yekutieli (2001) step-up FDR control
     Genomic inflation factor (based on median chi-squared) is 1.18739
     Mean chi-squared statistic is 1.14813
These values would actually suggest that although no very strong
stratification exists, there is perhaps a hint of an increased false
positive rate, as both values are greater than 1.00.
HINT The adjusted significance values that control for multiple
testing are, by default, based on the unadjusted significance values. If the flag
--gc is specified as well as --adjust then these adjusted values
will be based on the genomic-control significance value instead.
In this particular instance, where we already know about the
Chinese/Japanese subpopulations, it might be of interest to directly look
at the inflation factor that results from having population membership as
the phenotype in a case/control analysis, just to provide extra
information about the sample. That is, running the command using the
alternate phenotype option (i.e. replacing the disease phenotype with
the one in pop.phe, which is actually subpopulation membership):
plink --bfile hapmap1 --pheno pop.phe --assoc --adjust --out as3
we see that testing for frequency differences between Chinese and Japanese individuals, we do see some departure from the null distribution:
     Genomic inflation factor (based on median chi-squared) is 1.72519
     Mean chi-squared statistic is 1.58537
That is, the inflation factor of 1.7 represents the maximum possible
inflation factor if the disease were perfectly correlated with
subpopulation that could arise from the Chinese/Japanese split in the
sample (this does not account for any possible within-subpopulation
structure, of course, that might also increase SNP-disease false
positive rates).
We will return to this issue below, when we consider using the whole genome data
to detect stratification more directly.
Genotypic and other association models
We can calculate association statistics based on the 2-by-3 genotype table as well as the
standard allelic test; we can also calculate tests that assume dominant or recessive action
of the minor allele; finally, we can perform the Cochran-Armitage trend test instead of the
basic allelic test. All these tests are performed with the single command --model.
Just as the --assoc command, this can be easily applied to all SNPs. In this case, let's
just run it for our SNP of interest, rs2222162
plink --bfile hapmap1 --model --snp rs2222162 --out mod1
This generates the file mod1.model which has more than one row per SNP, representing the different tests performed for each SNP. The format of this file is described here. The tests are the basic allelic test, the Cochran-Armitage trend test, dominant and recessive models and a genotypic test. All test statistics are distributed as chi-squared with 1 df under the null, with the exception of the genotypic test which has 2 df. But there is a problem here: in this particular case, running the basic model command will not produce values for the genotypic tests. This is because, by default, every cell in the 2-by-3 table is required to have at least 5 observations, which does not hold here. This default can be changed with the --cell option. This option is followed by the minimum number of counts in each cell of the 2-by-3 table required before these extended analyses are performed. For example, to force the genotypic tests for this particular SNP just for illustrative purposes, we need to run:plink --bfile hapmap1 --model --cell 0 --snp rs2222162 --out mod2
and now the genotypic tests will also be calculated, as we set the minimum number in each cell to 0. We see that the genotype counts in affected and unaffected individuals are
     CHR         SNP     TEST        AFF      UNAFF    CHISQ   DF           P
       2   rs2222162     GENO    3/19/22    17/22/6    19.15    2   6.932e-05
       2   rs2222162    TREND      25/63      56/34    19.15    1   1.207e-05
       2   rs2222162  ALLELIC      25/63      56/34    20.51    1   5.918e-06
       2   rs2222162      DOM      22/22       39/6    13.87    1   0.0001958
       2   rs2222162      REC       3/41      17/28    12.24    1   0.0004679
which, reassuringly, match the values presented in the table above, which were generated when the
trait was simulated. Looking at the other test statistics, we see all are highly significant
(as would be expected for a strong, common, allelic effect)
although the allelic test has the most significant p-value. This makes sense,
as the data were essentially simulated under an allelic (dosage) model.
Stratification analysis
The analyses so far have ignored the fact that our sample consists of two similar, but distinct
subpopulations, the Chinese and Japanese samples. In this particular case, we
already know that the sample consists of these two groups; we also know that the disease is more prevalent
in one of the groups. More generally, we might not know anything of potential population substructure
in our sample upfront. One way to address such issues is to use whole genome data to cluster individuals
into homogeneous groups. There are a number of options and different ways
of performing this kind of analysis in PLINK and we will not
cover them all here. For illustrative purposes, we shall perform a
cluster analysis that pairs up individuals on the basis of genetic
identity. The command, which may take a number of minutes to run, is:
plink --bfile hapmap1 --cluster --mc 2 --ppc 0.05 --out str1
which requests IBS clustering (--cluster) but with the constraints that each cluster has no more than two individuals (--mc 2) and that any pair of individuals who have a significance value of less than 0.05 for the test of whether or not the two individuals belong to the same population based on the available SNP data are not merged. These options and tests are described in further detail in the relevant main documentation. We see the following output in the log file and on the console:
     ...
     Clustering individuals based on genome-wide IBS
     Merge distance p-value constraint = 0.05
     Of these, 3578 are pairable based on constraints
     Writing cluster progress to [ plink.cluster0 ]
     Cannot make clusters that satisfy constraints at step 45
     Writing cluster solution (1) [ str1.cluster1 ]
     Writing cluster solution (2) [ str1.cluster2 ]
     Writing cluster solution (3) [ str1.cluster3 ]
     ...
which indicate that IBS-clustering has been performed. These files are described in the main documentation.
The file str1.cluster1 contains the results of clustering in a format that is easy to read:
more str1.cluster1
     SOL-0    HCB181_1 JPT260_1
     SOL-1    HCB182_1 HCB225_1
     SOL-2    HCB183_1 HCB193_1
     SOL-3    HCB184_1 HCB202_1
     SOL-4    HCB185_1 HCB217_1
     SOL-5    HCB186_1 HCB196_1
     SOL-6    HCB187_1 HCB213_1
     SOL-7    HCB188_1 HCB194_1
     SOL-8    HCB189_1 HCB192_1
     SOL-9    HCB190_1 HCB224_1
     SOL-10   HCB191_1 HCB220_1
     SOL-11   HCB195_1 HCB204_1
     SOL-12   HCB197_1 HCB211_1
     SOL-13   HCB198_1 HCB210_1
     SOL-14   HCB199_1 HCB221_1
     SOL-15   HCB200_1 HCB218_1
     SOL-16   HCB201_1 HCB206_1
     SOL-17   HCB203_1 HCB222_1
     SOL-18   HCB205_1 HCB208_1
     SOL-19   HCB207_1 HCB223_1
     SOL-20   HCB209_1 HCB219_1
     SOL-21   HCB212_1 HCB214_1
     SOL-22   HCB215_1 HCB216_1
     SOL-23   JPT226_1 JPT242_1
     SOL-24   JPT227_1 JPT240_1
     SOL-25   JPT228_1 JPT244_1
     SOL-26   JPT229_1 JPT243_1
     SOL-27   JPT230_1 JPT267_1
     SOL-28   JPT231_1 JPT236_1
     SOL-29   JPT232_1 JPT247_1
     SOL-30   JPT233_1 JPT248_1
     SOL-31   JPT234_1 JPT255_1
     SOL-32   JPT235_1 JPT264_1
     SOL-33   JPT237_1 JPT250_1
     SOL-34   JPT238_1 JPT241_1
     SOL-35   JPT239_1 JPT253_1
     SOL-36   JPT245_1 JPT262_1
     SOL-37   JPT246_1 JPT263_1
     SOL-38   JPT249_1 JPT258_1
     SOL-39   JPT251_1 JPT252_1
     SOL-40   JPT254_1 JPT261_1
     SOL-41   JPT256_1 JPT265_1
     SOL-42   JPT257_1
     SOL-43   JPT259_1 JPT269_1
     SOL-44   JPT266_1 JPT268_1
Here we see that all but one pair are concordant for being Chinese or
Japanese (the IDs for each individual are in this case coded to represent
which HapMap subpopulation they belong to: HCB and JPT. Note,
these do not represent any official HapMap coding/ID schemes -- I've used
them purely to make it clear which population each individual belongs to).
We see that one individual was not paired with anybody else, as there is
an odd numbered of subjects overall. This individual would not
contribute to any subsequent association testing that conditions on
this cluster solution. We also see that the
Japanese individual JPT260_1 paired with a Chinese individual
HCB181_1 rather than JPT257_1. Clearly, this
means that HCB181_1 and JPT260_1 do not differ
significantly based on the test we performed: this test will have limited
power to distinguish individuals from very similar subpopulations,
alternatively, one of these individuals could be of mixed ancestry. In
any case, it is interesting that JPT260_1 was not paired with
JPT257_1 instead. Further inspection of the data actually reveal
that JPT257_1 is somewhat unusual, having very long stretches
of homozygous genotypes (use the --homozyg-kb and
--homozyg-snp options) are a high inbreeding coefficient, which
probably explain why this individual was not considered similar to the
other Japanese individuals by this algorithm.
Note By using the --genome option, it is
possible to examine the significance tests for all pairs of individuals,
as described in the main documentation.
Association analysis, accounting for clusters
After having performed the above matching based on genome-wide IBS, we
can now perform the association test
conditional on the matching. For this, the relevant file is the
str1.cluster2 file, which contains
the same information as str1.cluster1 but in the format of a
cluster variable file, that can be used in conjunction with the
--within option.
For this matched analysis, we shall use the Cochran-Mantel-Haenszel
(CMH) association statistic, which tests for SNP-disease association
conditional on the clustering supplied by the cluster file; we will also
include the --adjust option to get a sorted list of
CMH association
results:
plink --bfile hapmap1 --mh --within str1.cluster2 --adjust --out aac1
The relevant lines from the log are:
     ...
     Reading clusters from [ str1.cluster2 ]
     89 of 89 individuals assigned to 45 cluster(s)
     ...
     Cochran-Mantel-Haenszel 2x2xK test, K = 45
     Writing results to [ aac1.cmh ]
     Computing corrected significance values (FDR, Sidak, etc)
     Genomic inflation factor (based on median chi-squared) is 1.03878
     Mean chi-squared statistic is 0.988748
     Writing multiple-test corrected significance values to [ aac1.cmh.adjusted ]
     ...
We see that PLINK has correctly assigned the individuals to 45
clusters (i.e. one of these clusters is of size 1, all others are pairs)
and then performs the CMH test. The genomic control inflation
factors are now reduced to essentially 1.00, which is consistent with the
idea that there was some substructure inflating the distribution of test
statistics in the previous analysis.
Looking at the adjusted results file:
more aac1.cmh.adjusted
 CHR        SNP      UNADJ         GC    BONF    HOLM  SIDAK_SS  SIDAK_SD   FDR_BH  FDR_BY
   2  rs2222162  1.906e-06  2.963e-06  0.1241  0.1241    0.1167    0.1167   0.1241       1
   2  rs4673349  6.436e-06  9.577e-06  0.4192  0.4191    0.3424    0.3424   0.1261       1
   2  rs1375352  6.436e-06  9.577e-06  0.4192  0.4191    0.3424    0.3424   0.1261       1
  13  rs9585021  7.744e-06  1.145e-05  0.5043  0.5043    0.3961    0.3961   0.1261       1
   2  rs4675607  5.699e-05  7.845e-05       1       1    0.9756    0.9756   0.7423       1
  13  rs9520572  0.0002386  0.0003122       1       1         1         1   0.9017       1
  11   rs992564    0.00026  0.0003392       1       1         1         1   0.9017       1
  12  rs1290910  0.0002738  0.0003566       1       1         1         1   0.9017       1
   4  rs1380899  0.0002747  0.0003577       1       1         1         1   0.9017       1
  14  rs1190968  0.0002747  0.0003577       1       1         1         1   0.9017       1
   8   rs951702  0.0003216  0.0004164       1       1         1         1   0.9017       1
   ...
Here we see that the "disease" variant, rs2222162 has moved from being number 2 in the list to number 1, although it is still not significant after genome-wide correction. In this last example, we specifically requested that PLINK pair up the most similar individuals. We can also perform the clustering, but with fewer, or different, constraints on the final solution. For example, here we do not impose a maximum cluster size: rather we request that each cluster contains at least 1 case and 1 control (i.e. so that it is informative for association) with the --cc option, and specify a threshold of 0.01 for --ppc:
plink --bfile hapmap1 --cluster --cc --ppc 0.01 --out version2
which generates the following final solution (version2.cluster1):
SOL-0    HCB181_1(1) HCB189_1(1) HCB198_1(1) HCB210_1(2) HCB222_1(1) HCB203_1(1) HCB196_1(1)
         HCB183_1(2) HCB195_1(1) HCB185_1(1) HCB187_1(1) HCB215_1(2) HCB216_1(1)

SOL-1    HCB182_1(1) HCB186_1(1) HCB207_1(2) HCB223_1(1) HCB194_1(1) HCB188_1(1) HCB199_1(1)
         HCB221_1(2) HCB225_1(1) HCB217_1(1) HCB190_1(1) HCB202_1(1) HCB224_1(2) HCB201_1(2)
         HCB206_1(1) HCB208_1(1) HCB209_1(1) HCB213_1(1) HCB212_1(1) HCB214_1(2)

SOL-2    HCB184_1(1) HCB219_1(2) HCB218_1(1) HCB200_1(1) HCB191_1(2) HCB220_1(1) HCB197_1(1)
         HCB211_1(2) HCB192_1(1) HCB204_1(1) JPT255_1(2) HCB193_1(1) JPT245_1(2)

SOL-3    HCB205_1(1) JPT264_1(2) JPT253_1(1) JPT258_1(2) JPT228_1(1) JPT244_1(2) JPT238_1(2)
         JPT269_1(2) JPT242_1(2) JPT234_1(2) JPT265_1(1) JPT230_1(2) JPT262_1(1) JPT267_1(2)
         JPT231_1(1) JPT239_1(2) JPT263_1(2) JPT260_1(2)

SOL-4    JPT226_1(1) JPT251_1(2) JPT240_1(2) JPT227_1(2) JPT232_1(2) JPT235_1(2) JPT237_1(2)
         JPT250_1(1) JPT246_1(2) JPT229_1(2) JPT243_1(1) JPT266_1(2) JPT252_1(2) JPT249_1(2)
         JPT233_1(1) JPT248_1(2) JPT241_1(2) JPT254_1(1) JPT261_1(2) JPT259_1(2) JPT236_1(2)
         JPT256_1(1) JPT247_1(2) JPT268_1(2) JPT257_1(2)
The lines have been wrapped for clarity of reading here: normally, an entire cluster file is on a
single line. Also note that the phenotype has been added in parentheses after each
family/individual ID (as the --cc option was used). Here we see that the resulting
clusters have largely separated Chinese and Japanese individuals into different clusters. The
clustering results in a five class solution based on the
--ppc constraint -- i.e.
clearly, to merge any of these five clusters would have involved merging two individuals who are
different at the 0.01 level, and this is why the clustering stopped at this point (as opposed to
merging everybody, ultimately arriving at a 1-class solution).
Based on this alternate clustering scheme, we can repeat our association
analysis.
Note This is not necessarily how actual analysis of real
data should be conducted, of course, i.e.
by trying different analyses, clusters, etc, until one finds the most
significant result... The point of this is just to show what options are
available.
plink --bfile hapmap1 --mh --within version2.cluster2 --adjust --out aac2
Now the log file records that five clusters were found, and a low inflation factor:
     ...
     Cochran-Mantel-Haenszel 2x2xK test, K = 5
     Writing results to [ aac2.cmh ]
     Computing corrected significance values (FDR, Sidak, etc)
     ...
     Genomic inflation factor (based on median chi-squared) is 1.01489
     Mean chi-squared statistic is 0.990643
     ...
Looking at aac2.cmh.adjusted, we now see that the disease SNP is genome-wide significant:
 CHR        SNP      UNADJ         GC     BONF     HOLM SIDAK_SS SIDAK_SD   FDR_BH    FDR_BY
   2  rs2222162  8.313e-10  1.104e-09 5.47e-05 5.47e-05 5.47e-05 5.47e-05 5.47e-05 0.0006384
  13  rs9585021  2.432e-06  2.882e-06     0.16     0.16   0.1479   0.1479  0.06931     0.809
   2  rs4675607   3.16e-06  3.731e-06   0.2079   0.2079   0.1877   0.1877  0.06931     0.809
   2  rs4673349   5.63e-06  6.594e-06   0.3705   0.3705   0.3096   0.3096   0.0741    0.8648
   2  rs1375352   5.63e-06  6.594e-06   0.3705   0.3705   0.3096   0.3096   0.0741    0.8648
   ...
That is, rs2222162 now has a significance value of 5.47e-05 even if we use Bonferroni adjustment for multiple comparisons. A third way to perform the stratification analysis is to specify the number of clusters one wants in the final solution. Here we will specify two clusters, using the --K option, and remove the significance test constraint by setting --ppc to 0 (by omitting that option):
plink --bfile hapmap1 --cluster --K 2 --out version3
This analysis results in the following two-class solution:
SOL-0 HCB181_1 HCB182_1 HCB225_1 HCB189_1 HCB188_1 HCB194_1 HCB205_1
      HCB208_1 HCB199_1 HCB221_1 HCB201_1 HCB206_1 HCB196_1 JPT253_1
      HCB202_1 HCB203_1 HCB191_1 HCB220_1 HCB197_1 HCB211_1 HCB215_1
      HCB216_1 HCB212_1 HCB213_1 HCB183_1 HCB195_1 HCB193_1 HCB186_1
      HCB207_1 HCB223_1 HCB187_1 HCB209_1 HCB214_1 HCB184_1 HCB219_1
      HCB218_1 HCB200_1 HCB185_1 HCB217_1 HCB198_1 HCB210_1 HCB222_1
      HCB192_1 HCB190_1 HCB224_1

SOL-1 HCB204_1 JPT255_1 JPT257_1 JPT226_1 JPT242_1 JPT228_1 JPT244_1
      JPT238_1 JPT269_1 JPT232_1 JPT247_1 JPT231_1 JPT239_1 JPT229_1
      JPT243_1 JPT236_1 JPT256_1 JPT265_1 JPT227_1 JPT266_1 JPT268_1
      JPT263_1 JPT235_1 JPT237_1 JPT250_1 JPT246_1 JPT240_1 JPT251_1
      JPT259_1 JPT252_1 JPT233_1 JPT248_1 JPT241_1 JPT254_1 JPT261_1
      JPT245_1 JPT264_1 JPT249_1 JPT258_1 JPT230_1 JPT267_1 JPT262_1
      JPT234_1 JPT260_1
Here we see that the solution has assigned all Chinese and all Japanese
two separate groups except for two individuals. If we use this cluster
solution in the association analysis, we obtain the following results,
again obtaining genome-wide significance:
 CHR        SNP      UNADJ        GC     BONF     HOLM SIDAK_SS SIDAK_SD   FDR_BH    FDR_BY
   2  rs2222162  8.951e-10 1.493e-09 5.89e-05 5.89e-05 5.89e-05 5.89e-05 5.89e-05 0.0006875
   2  rs4675607  9.255e-06 1.217e-05    0.609    0.609   0.4561   0.4561   0.2679         1
  13  rs9585021  1.222e-05 1.594e-05   0.8038   0.8038   0.5524   0.5524   0.2679         1
   2  rs1375352  2.753e-05 3.519e-05        1        1   0.8366   0.8365   0.3505         1
   2  rs4673349  2.753e-05 3.519e-05        1        1   0.8366   0.8365   0.3505         1
   9  rs7046471  3.196e-05 4.071e-05        1        1   0.8779   0.8779   0.3505         1
   6  rs9488062  4.481e-05 5.659e-05        1        1   0.9476   0.9476   0.4213         1
   ...
with similarly low inflation factors:
     Genomic inflation factor (based on median chi-squared) is 1.02729
     Mean chi-squared statistic is 0.982804
Finally, given that the actual ancestry of each individual is known in
this particular sample, we can always use this external clustering in the
analysis:
plink --bfile hapmap1 --mh --within pop.phe --adjust --out aac3
Unsurprisingly, this gives very similar results to the two-class solution derived from cluster analysis. In summary,- We have seen that simple IBS-based clustering approaches seem to work well, at least in terms of differentiating between Chinese and Japanese individuals, with this number of SNPs
- We have seen that accounting for this population substructure can lower false positive rates and increase power also - the disease variant is only genome-wide significant after performing a stratified analysis
- We have seen a number of different approaches to clustering applied. Which to use in practice is perhaps not a straightforward question. In general, when a small number of discrete subpopulations exist in the sample, then a cluster solution that most closely resembles this structure might be expected to work well. In contrast, if, instead of a small number of discrete, homogeneous clusters, the sample actually contains a complex mixture of individuals from across a range of clines of ancestry, then we might expect the approaches that form a large number of smaller classes (e.g. matching pairs) to perform better.
plink --bfile hapmap1 --cluster --matrix --out ibd_view
which generates a file ibd_view.mdist. Then, in R, perform the following commands: (note: obviously, you need R installed for to perform these next actions -- it can be freely downloaded here)m <- as.matrix(read.table("ibd_view.mdist"))
mds <- cmdscale(as.dist(1-m))
k <- c( rep("green",45) , rep("blue",44) )
plot(mds,pch=20,col=k)
which should generate a plot like this: (green represents Chinese individuals, blue represents Japanese individuals).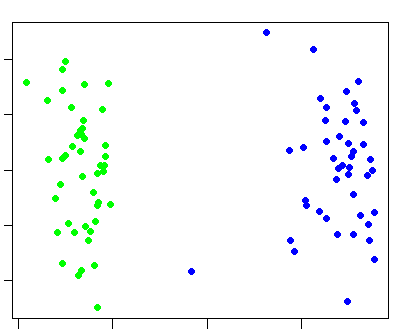
plink --bfile hapmap1 --assoc --pheno qt.phe --out quant1
This analysis generates a file quant1.qassoc which has the following fields:CHR SNP NMISS BETA SE R2 T P 1 rs6681049 89 -0.2266 0.3626 0.004469 -0.6249 0.5336 1 rs4074137 89 -0.2949 0.6005 0.002765 -0.4911 0.6246 1 rs1891905 89 -0.1053 0.3165 0.001272 -0.3328 0.7401 1 rs9729550 89 0.5402 0.4616 0.0155 1.17 0.2451 1 rs3813196 89 0.8053 1.025 0.00705 0.7859 0.434 1 rs12044597 89 0.01658 0.3776 2.217e-05 0.04392 0.9651 1 rs10907185 89 0.171 0.373 0.00241 0.4584 0.6478 1 rs11260616 88 0.03574 0.444 7.533e-05 0.08049 0.936 1 rs745910 87 -0.3093 0.4458 0.005632 -0.6938 0.4897 1 rs262688 89 0.411 0.4467 0.009637 0.9201 0.3601 1 rs2460000 89 -0.03558 0.3821 9.969e-05 -0.09314 0.926 1 rs260509 89 -0.551 0.438 0.01787 -1.258 0.2118 ...The fields in this file represent:
- Chromosome
- SNP identifier
- Number of non-missing individuals for this analysis
- Regression coefficient
- Standard error of the coefficient
- The regression r-squared (multiple correlation coefficient)
- t-statistic for regression of phenotype on allele count
- Asymptotic significance value for coefficient
CHR        SNP      UNADJ         GC      BONF      HOLM  SIDAK_SS  SIDAK_SD    FDR_BH    FDR_BY
  2  rs2222162  9.083e-11  3.198e-09 5.977e-06 5.977e-06 5.977e-06 5.977e-06 5.977e-06 6.976e-05
 21   rs219746  1.581e-07  1.672e-06   0.01041    0.0104   0.01035   0.01035  0.005203   0.06072
  7  rs1922519  4.988e-06  3.038e-05    0.3283    0.3282    0.2798    0.2798    0.1094         1
  2  rs2969348  1.008e-05  5.493e-05    0.6636    0.6636     0.485     0.485    0.1122         1
  3  rs6773558  1.313e-05  6.857e-05    0.8638    0.8638    0.5785    0.5784    0.1122         1
 10  rs3862003  1.374e-05  7.123e-05    0.9038    0.9038     0.595     0.595    0.1122         1
  8   rs660416  1.554e-05  7.905e-05         1         1    0.6405    0.6404    0.1122         1
 14  rs2526935  1.611e-05  8.146e-05         1         1    0.6536    0.6535    0.1122         1
 ...
Here we see that the disease variant is significant after genome-wide correction. However, these tests do not take into account the clustering in the sample in the same way we did before. The genomic control inflation factor estimate is now:
     Genomic inflation factor (based on median chi-squared) is 1.19824
     Mean chi-squared statistic is 1.21478
Instead of performing a stratified analysis or including covariates, one approach is to use permutation:
specifically, it is possible to permute (i.e. label-swap phenotypes between individuals) but only
within cluster. This controls for any between-cluster association, as this will be constant under
all permuted datasets. We request clustered permutation as follows, using the original pairing approach
to matching:
plink --bfile hapmap1 --assoc --pheno qt.phe --perm --within str1.cluster2 --out quant2
In this case we are using adaptive permutation. See the section of the main documentation that describes permutation testing for more details. The output will show:
     ...
     89 of 89 individuals assigned to 45 cluster(s)
     ...
     Set to permute within 45 cluster(s)
     Writing QT association results to [ quant2.qassoc ]
     Adaptive permutation: 1000000 of (max) 1000000 : 25 SNPs left
This analysis will take some time depending on how fast your computer is, probably at least 1
hour. The last line shown above will change, counting the number of permutations performed, and
the number of SNPs left in the analysis at any given stage. Here it reaches the default maximum
of 1 million permutations and 25 SNPs remain still (see the link above for more details on this
procedure).
The adaptive permutation procedure results in a file quant2.qassoc.perm. Sorting
this file by the emprical p-value (EMP1, the fourth column) we see that the
disease variant rs2222162 is top of the list, with an empirical significance
value of 1e-6 (essentially indicating that no permuted datasets had a statistic for
rs2222162 that exceeded this).
 CHR          SNP      STAT          EMP1         NP
   2    rs2222162     42.01         1e-06    1000000
   6    rs1606447     5.869     5.206e-05      38415
  10    rs1393829     16.34     0.0001896      10549
  21     rs219746     27.49     0.0001896      10549
   2    rs2304287     9.021     0.0001896      10549
   6    rs2326873     6.659     0.0001896      10549
   2    rs1385855      7.59     0.0002227      13468
   2    rs6543704     8.131     0.0002227      13468
   ...
IMPORTANT When using the --within option along with permutaion, the empirical significance values EMP1 will appropriately reflect that we have controlled for the clustering variable. In contrast, the standard chi-squared statistics (STAT in this file) will not reflect the within-cluster analysis. That is, the test used is the same identical test as used in standard analysis -- the only thing that changes is the way we permute the sample. The STAT values will be identical to the standard, non-clustered analysis therefore. The NP field shows how many permutations were conducted for each SNP. For the SNPs at the bottom of the list, PLINK may well have given up after only 6 permutations (i.e. these were SNPs that were clearly not going to be highly significant if after 6 permutations they were exceeded more than a couple of times). Naturally, this approach speeds up permutation analysis but does not provide a means for controlling for multiple testing (i.e. by comparing each observed test statistic against the maximum of all permuted statistics in each replicate). This can be achieved with the --mperm option:
plink --bfile hapmap1 --assoc --pheno qt.phe --mperm 1000 --within str1.cluster2 --out quant3
With --mperm you must also specify the number of replicates -- this number can be fairly low, as one is primarily interested in the corrected p-values being less than some reasonably high nominal value such as 0.05, rather than accurately estimating the point-wise empirical significance, which might be very small. Finally, we might want to test whether the association with the continuous phenotype differs between the two populations: for this we can use the --gxe option, along with population membership (which is currently limited to the dichotomous case) being specified as a covariate with the --covar option (same format as cluster files). Let's just perform this analysis for the main SNP of interest rather than all SNPs:plink --bfile hapmap1 --pheno qt.phe --gxe --covar pop.phe --snp rs2222162 --out quant3
The output will show that a file quant3.qassoc.gxe has been created, which contains the following fields:CHR SNP NMISS1 BETA1 SE1 NMISS2 BETA2 SE2 Z_GXE P_GXE 2 rs2222162 45 -2.271 0.2245 44 -1.997 0.1722 -0.9677 0.3332which show the number of non-missing individuals in each category along with the regression coefficient and standard error, followed by a test of whether these two regression coefficients are significantly different (Z_GXE) and an asymptotic significance value (P_GXE). In this case, we see the similar effect in both populations (regression coefficients around -2) and the test for interaction of SNP x population interaction is not significant. Extracting a SNP of interest Finally, given you've identified a SNP, set of SNPs or region of interest, you might want to extract those SNPs as a separate, smaller, more manageable file. In particular, for other applications to analyse the data, you will need to convert from the binary PED file format to a standard PED format. This is done using the --recode options (fully described here). There are a few forms of this option: we will use the --recodeAD that codes the genotypes in a manner that is convenient for subsequent analysis in R or any other non-genetic statistical package. To extract only this single SNP, use:
plink --bfile hapmap1 --snp rs2222162 --recodeAD --out rec_snp1
(to select a region, use the --to and --from options instead, or use --window 100 with --snp to select a 100kb region surrounding that SNP, for example). This particular recode feature codes genotypes as additive (0,1,2) and dominance (0,1,0) components, in a file called rec_snp1.recode.raw. We can then load this file into our statistics package and easily perform other analyses: for example, to repeat the main analysis as a simple logistic regression using the R package (not controlling for clusters):d <- read.table("rec_snp1.recode.raw" , header=T)
summary(glm(PHENOTYPE-1 ~ rs2222162_A, data=d, family="binomial"))
     Coefficients:
                 Estimate Std. Error z value Pr(>|z|)
     (Intercept)  -1.6795     0.4827  -3.479 0.000503 ***
     rs2222162_A   1.5047     0.3765   3.997 6.42e-05 ***
which confirms the original analysis. Naturally, things such as survival analysis
or other models not implemented in PLINK can now be performed.
Other areas...
That's all for this tutorial. We've seen how to use PLINK to analyse a dummy dataset. Hopefully
things went smoothly and you are now more familiar with using PLINK and can start applying it
to your own datasets. There are a large number of areas that we have not even touched here:
- Using haplotype-based tests, or other multi-locus tests (Hotelling's T(2) test, etc)
- Analysing family-based samples
- Other summary statistic measures such as Hardy-Weinberg and Mendel errors
- Estimating IBD between pairs of individuals
- Tests of epistasis
- Data-management options such as merging files
- etc