Polarity issues in the NSRR
Many analyses of sleep EEG data are effectively agnostic to the polarity of the EEG signal. That is, you could flip the signal (i.e. multiply every sample value by -1) and still obtain equivalent results, e.g. from most spectral analyses. For certain analyses that consider the phase of a signal, however, it will matter that the polarity of the signal is correct. As described below, one such case is the temporal coupling between spindles and slow oscillations.
Key points covered in this vignette:
-
we discovered some issues with the polarity of EEG signals in some NSRR studies (i.e. that they were flipped or upside-down: positive-to-negative and vice versa)
-
we tracked the source of the issue to an error in one of the older tools used upstream in the NSRR workflow (which might impact not just EEG signals, although that is not explored here)
-
we considered some approaches to flag whether a sleep EEG channel is likely to be flipped
-
bottom line: if you are performing analyses that depend on phase relationships in NSRR data, you should attend to this issue!
The data
We considered seven NSRR datasets:
CCSHS,
CFS,
SHHS (waves 1 and 2),
MESA,
MrOS and
SOF. For the purpose of this
vignette, we'll consider the two EEG channels (C3, C4) from each
study, along with the two EOG channels (LOC and ROC), on a total
of 15,048 sleep studies.
Cross-channel correlations
Perhaps the easiest way to jump into this is by considering the
distribution of cross-channel correlations (C3 by C4, each
referenced to the contralateral mastoid) in individuals from the above
studies. (Actually, the MESA study is not included in this first
set of correlational analyses, as it does not have a C3 channel.)
Using the CORREL command, we
observed the following:
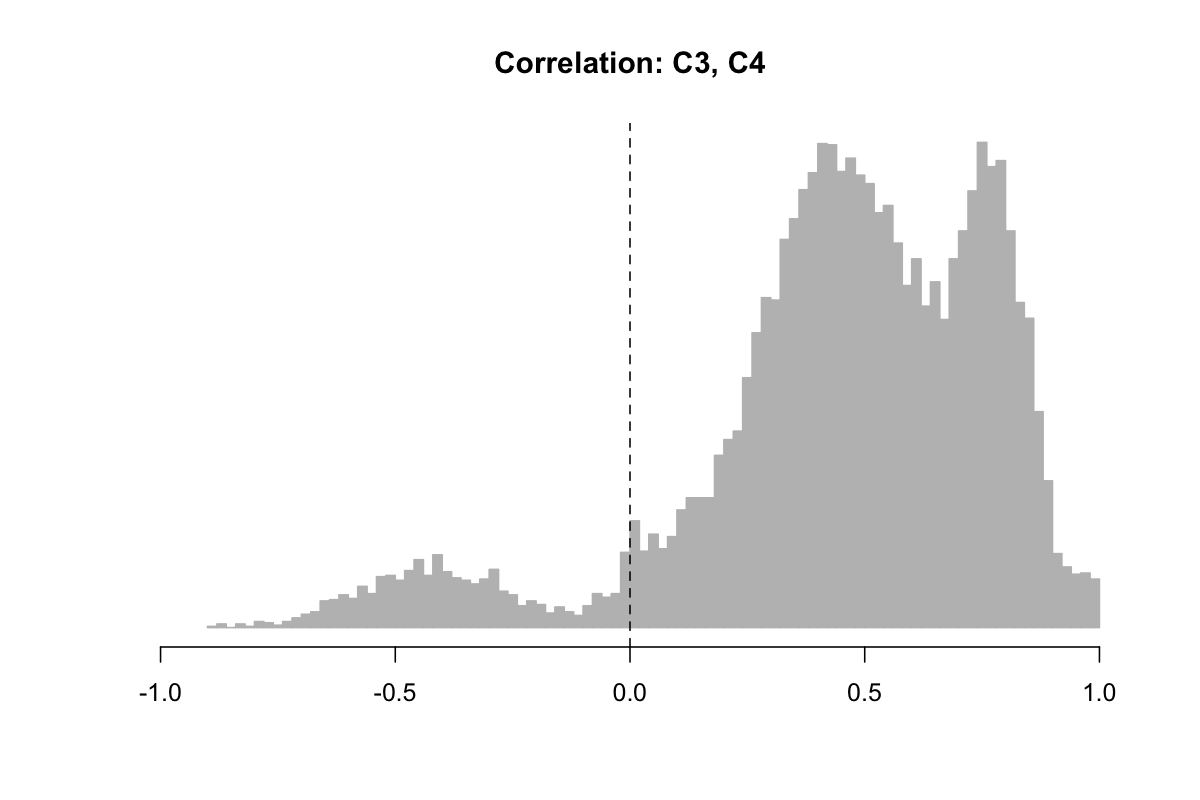
Even given that we are averaging across heterogeneous studies, this tri-modal distribution is surprising, as it includes a peak of negative correlations. Typically, one would expect positive correlations, if any, between ~nearby electrodes, given the typical nature of functional coherence and globally-operating elements of sleep micro-architecture, not to mention volume conductance in the scalp EEG.
Info
Correlations are the Pearson's correlation coefficient, calculated epoch-by-epoch between the two time series, then averaged over all epochs for a given individual.
When splitting out the above histogram by study, we observed that the preponderance of negative C3-C4 correlations came from SHHS1, as shown below. Given that we did not see this effect in SHHS2 (or any of the other studies) and given that it is highly unlikely to reflect a genuine physiological effect, we assumed some kind of artifact (or analytic error) was at play here:
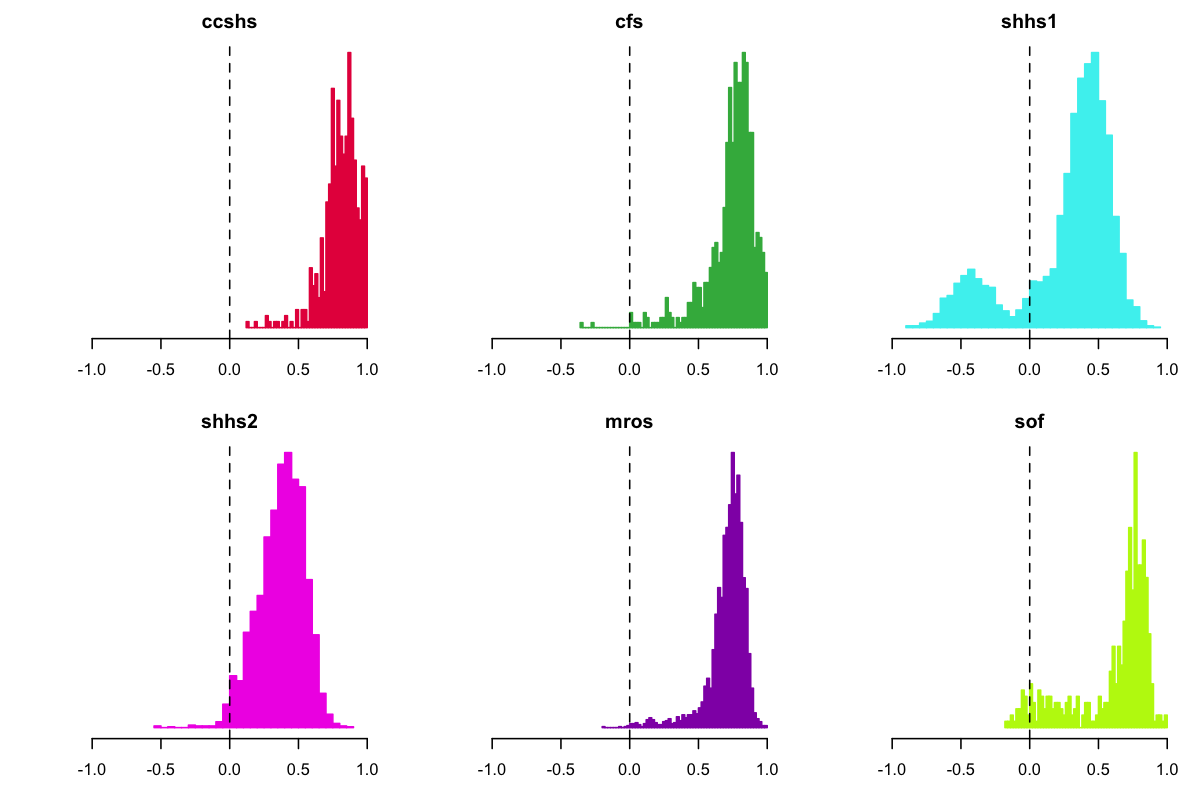
SHHS positive correlations
Although beyond the scope of this vignette, also note that both SHHS studies tended to have lower positive mode (leading to the bimodality when combining all cohorts, as in the first plot). Although some of this effect could reflect genuine physiological differences, it more likely reflects other technical and methodological differences between studies, e.g. the placement of electrodes and the quality of the recording.
Going back to the full dataset (but still excluding MESA for now), we next looked at the EOG channels. Specifically, what did the distribution of EOG-EOG and (ipsilateral) EEG-EOG correlations look like? Here we saw another unexpected set of multi-modal distributions:
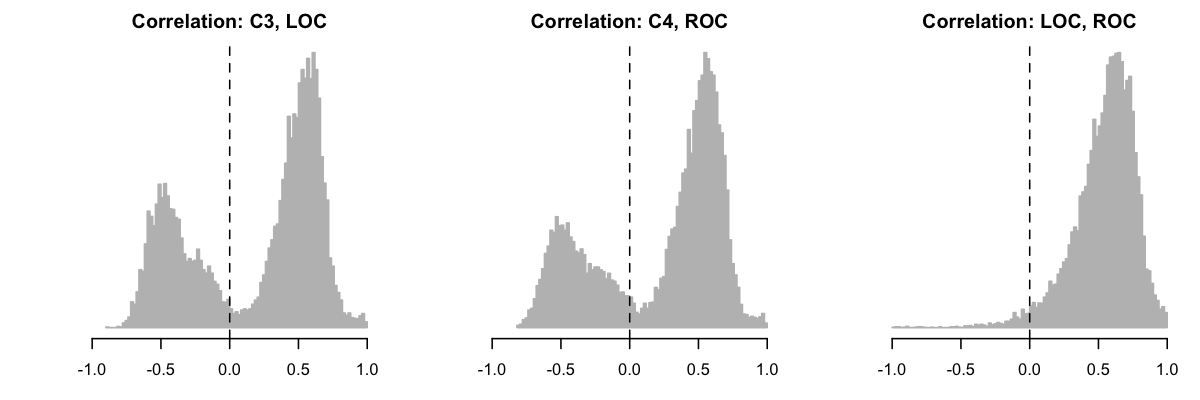
Splitting one of the EEG-EOG correlations (C3-LOC) by study, we
again saw that SHHS1 appeared to be an outlier, in having a
preponderance of negative EEG-EOG correlations. In other words, for
those people, when the EEG channel showed a positive deflection, more
often than not the (ipsilateral) EOG showed a negative deflection,
and vice versa, despite having similar reference electrodes.
Looking only at SHHS1, we plotted all four correlations (EEG-EEG, EOG-EOG and the two ipsilateral EEG-EOG comparisons) as a function of the position in the dataset (i.e. with each of ~5700 individuals as a point, ordered left-to-right on the x-axis according to their SHHS ID). In each case, the y-axis goes from +1 (at the top) to -1 (at the bottom of each of the four plots):
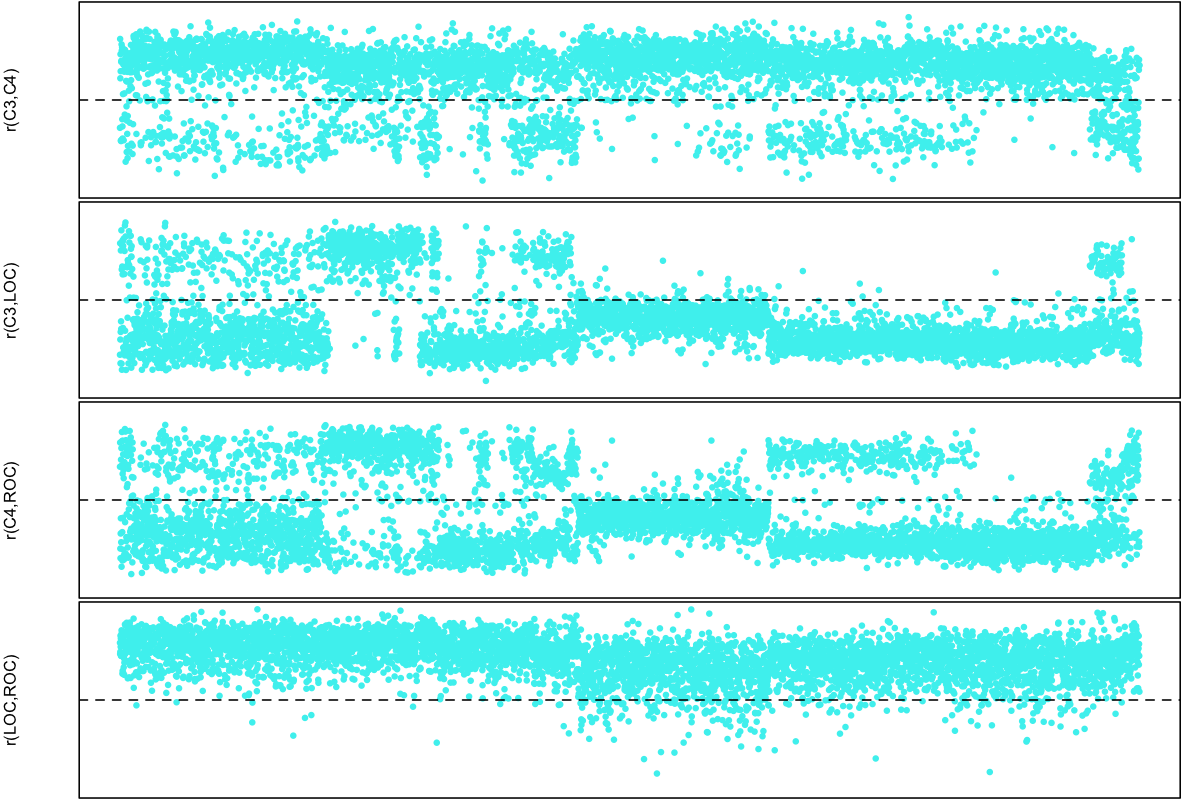
The apparent banding turns out to largely map onto different parent studies and collection clinics in SHHS1, which are not randomly distributed with respect to sample ID. To summarize this plot, we see in SHHS1:
-
both EOG channels are almost always concordant (i.e. have a positive correlations)
-
most, but not all, individuals have a negative correlation between C3 and LOC
-
most, but not all, individuals have a negative correlation between C4 and ROC
-
most, but not all, individuals have a positive correlation between C3 and C4
-
the people who have a positive C4-ROC correlation but a negative C3-LOC correlation tended to have a negative C3-C4 correlation
This is consistent with the polarity being swapped for either 0, 1 or 2 EEG channels, if we assume all EOG channels have correct polarity.
After some further detective work, it indeed transpired that an early version
of the NSRR's
edf-editor-translator
tool appeared to have an issue in its EDF validation
code
that would have caused some signals to be flipped.
The cause of flipped polarities in NSRR
Specifically, it seems that the edf-editor-translator checked for
whether the EDF had a physical maximum (in the EDF
header) that was smaller the the physical minimum. Although this in itself is
not necessarily an error for an EDF, the tool nonetheless swapped the physical
min/max header values, but did not change any of the corresponding
sample points or the digital min/max. This effectively flips the
polarity of the signal, in any case where the EDF signal happened
to be encoded with negative gain.
The NSRR team is in the process of looking at the upstream processing of EDF files. If they are able to re-process these legacy datasets in a timely manner from scratch, then new EDFs with corrected polarities will be posted to the NSRR. This is no trivial task, however, as the original work involved manual steps to extract the thousands of EDFs from the proprietary formats, and not all intermediate files were saved.
In the mean time, for the rest of this vignette we first ask: so what? Does it matter that polarities may be flipped? Second, in the absence of re-processed data, we consider the type of heuristic that might flag sleep signals that are likely to be flipped.
Spindle/slow oscillation coupling
The particular case where we first encountered this polarity issue was when looking at spindle/slow oscillation coupling in some of the NSRR datasets. From previous work, although not necessarily a precise relationship (and one that is also age-dependent), we broadly expect on average for fast (e.g. 14 or 15 Hz) spindles to tend to occur on the rising slope of slow oscillations, with their peak (maximum spindle peak-to-peak amplitude) occurring near the positive peak of the slow oscillation. It is important to note that these relationships, as well as changing with age, may well be dependent on the particular approach to analysis (i.e. how spindles and/or slow oscillations are defined) and/or stage of sleep, so by themselves spindle/SO coupling cannot unambiguous identify whether a channel is flipped. However, it certainly is the case that any polarity flips will impact analyses of spindle/SO coupling. In particular, indications of strong bimodality in coupling metrics, in an otherwise comparable set of samples, can likely be informative about polarity flips, especially if the coupling metrics are also related to other indices of polarity issues (e.g. the cross-channel correlations as noted above).
In these NSRR datasets, we detected fast spindles and then, for each individual, estimated the (circular) mean phase of delta-band activity (via a filter-Hilbert method) across all spindle peaks. If the polarity of the EEG was flipped, we'd predict an "inverted" (i.e. phase-shifted by 180 degrees) spindle/SO-coupling relationship for that individual.
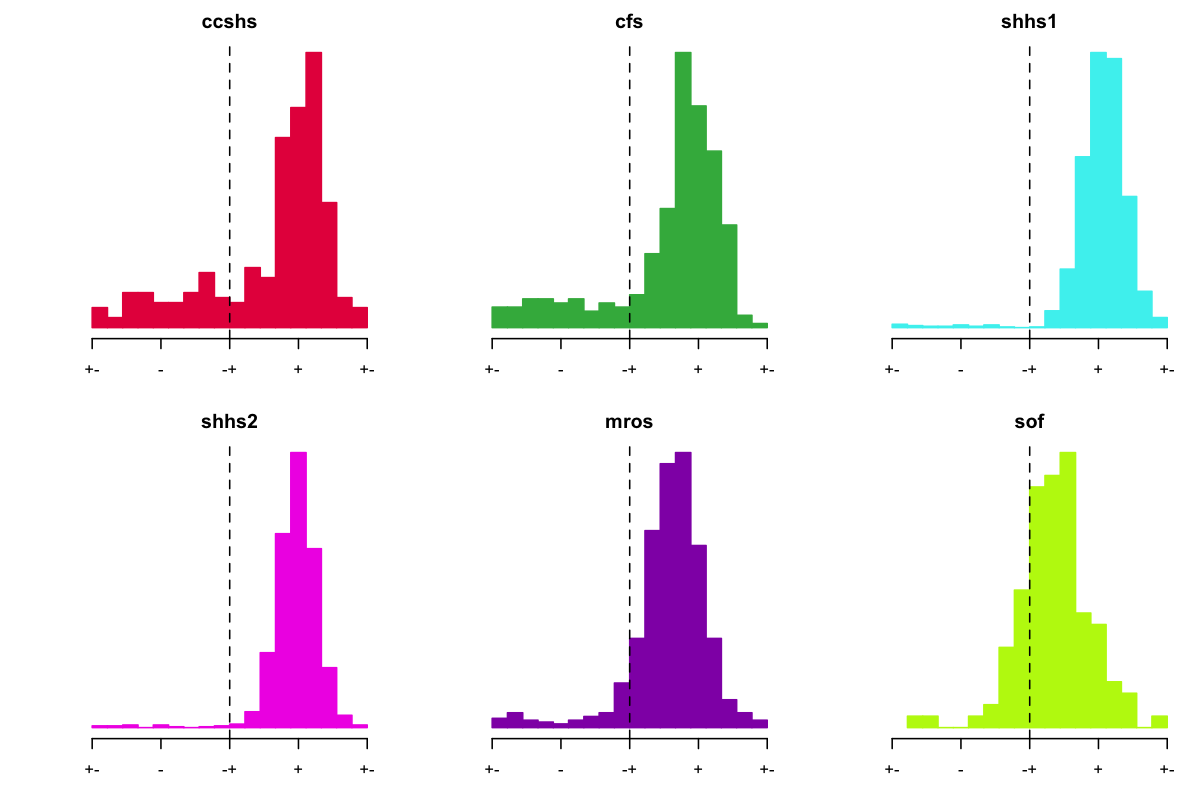
In the plots below, slow wave phase is on the x-axis, which goes from
0 (positive-to-negative zero-crossing, +-), to the negative peak
(- at 90 degrees), to the negative-to-positive zero-crossing (-+
at 180 degrees, with the dotted line), to the positive peak (+ at
270 degrees), and back to the positive-to-negative zero-crossing (+-
at 360/0 degrees). The histogram represents the number of individuals
whose mean phase at spindle peak was at that value:
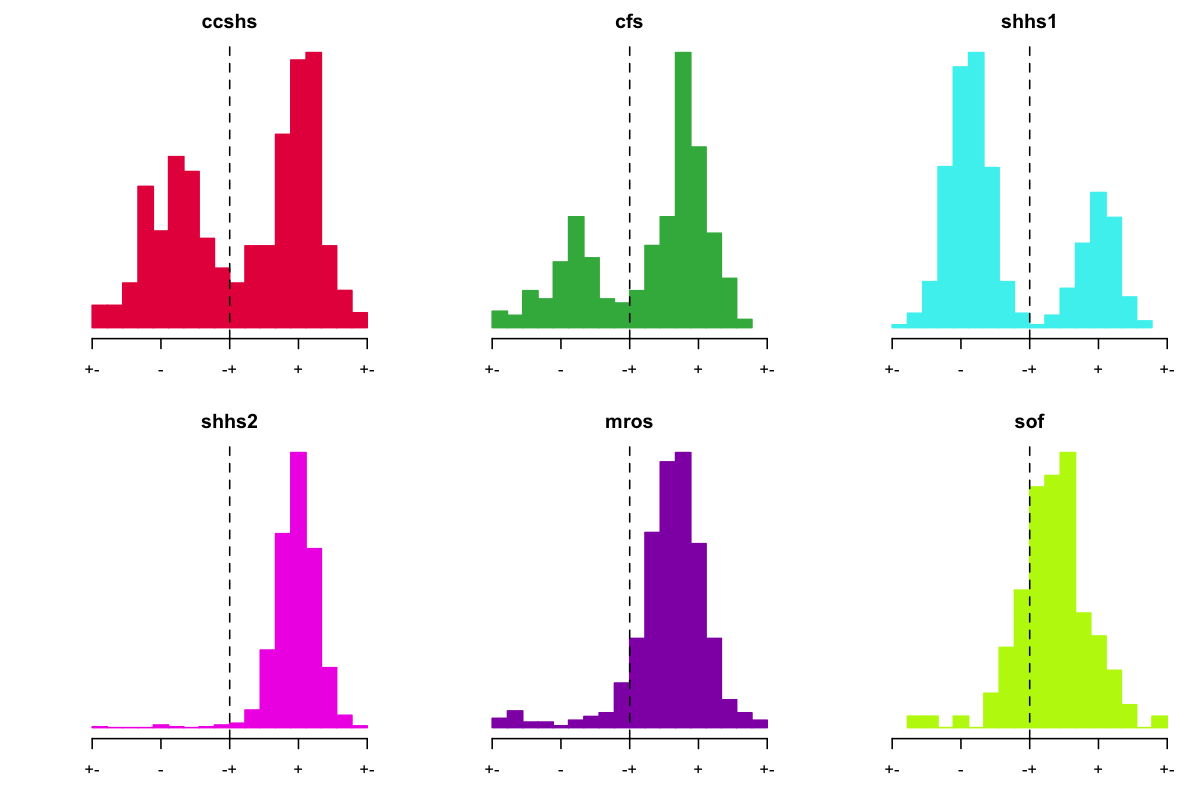
Wow! These certainly are some unexpected - and bimodal - distributions in the mean SO phase at spindle-peak for SHHS1, but also CCSHS and CFS. In contrast, SHHS2, MrOS and SOF had unimodal distributions, with most individuals having values somewhere around 230-270 degrees, i.e. on the positive peak of the slow oscillation as expected. In CCSHS, CFS and especially in SHHS1, we saw a clear mode around the negative peak (~90 degrees in these plots, and so phase-shifted approximately 180 degrees), consistent with a possible flip in EEG polarity. Is this what's going on?
Info
We are only plotting spindle/SO coupling metrics for individuals with nominally significant tests for non-uniform phase distribution. For many older individuals, in whom we often observe relatively few spindles, neither spindle, nor SO, nor their coupling relationships are necessarily clear-cut. As such, we cannot rely on spindle/SO coupling to unambiguously identify a flipped channel, even if we were to make the (very strong) assumption that only one of these modes was physiologically possible.
Focusing on SHHS1 for the moment: if we take individuals with a negative C4-ROC correlation (these were only found in SHHS1), and assume that their C4 channel was flipped, how does that change spindle/SO coupling (in SHHS1), i.e. if we phase-shift their spindle/SO mean phase by 180 degrees?
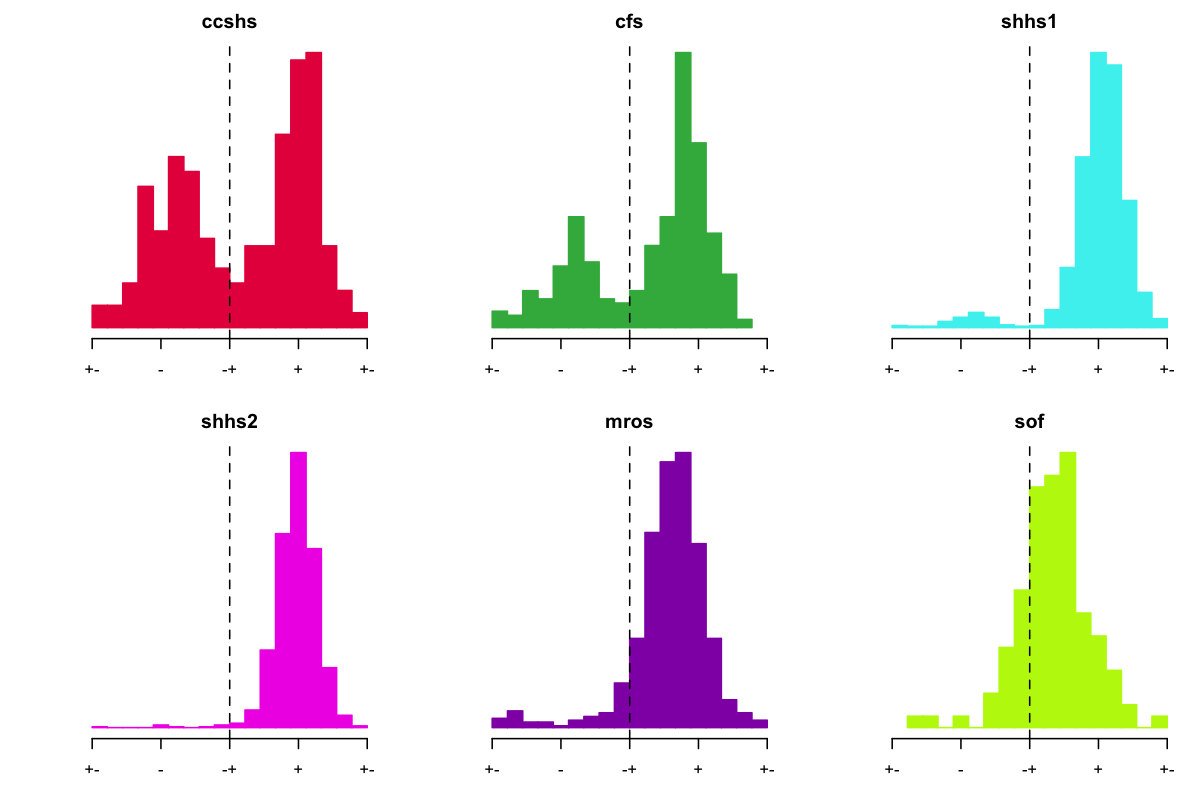
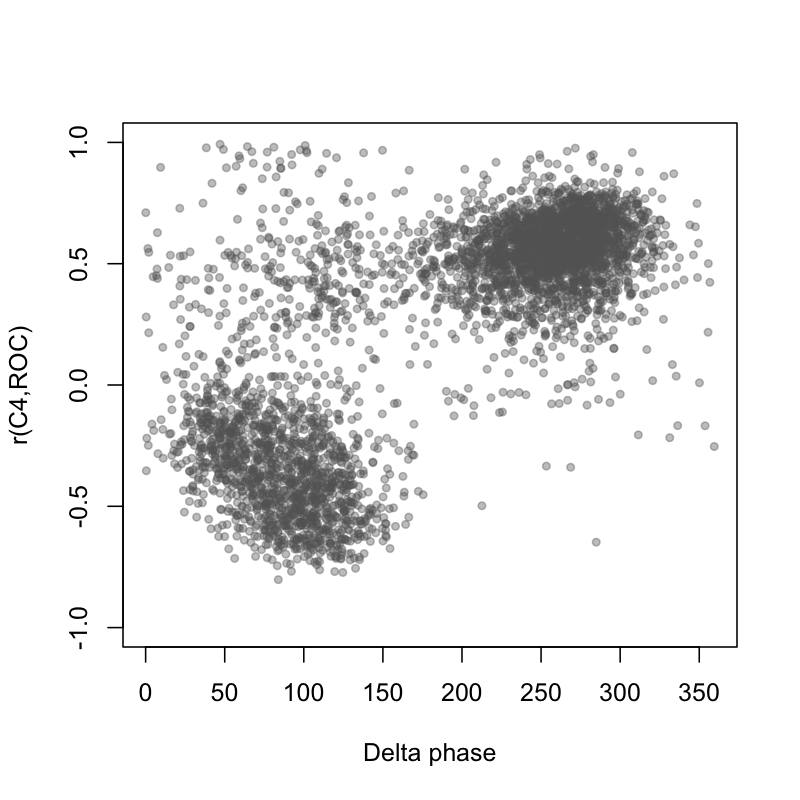
Good, this clears up the SHHS1 distribution somewhat. In other words, people with a negative EEG-EOG correlation also tended to show reversed spindle/SO coupling phase, consistent with a polarity flip in the EEG. There is still a small bump of SHHS1 individuals with seemingly reversed phase (most likely because thresholding the correlation at 0 is an imprecise way to identify the flips). Nonetheless, in SHHS1 these analyses seem have identified the likely problem, and pointed to a ~95% fix. Looking at this another way, the scatter plot between the C4-ROC correlation and mean SO/delta phase at spindle peak shows a clear relationship, suggesting that these two metrics are getting at the same thing (that is, flipped EEG polarity):
But what about CCSHS and CFS? Note that we previously did not observe any negative EEG-EEG or EEG-EOG correlations in CCSHS or CFS, only SHHS1. This does not mean that all individuals in CCSHS and CFS had correct EEG polarities, however: it could simply reflect that both EEG and EOG signals were flipped in some individuals. In that case, the flips would naturally be invisible in terms of cross-channel correlations (which only detect when one channel is flipped relative to another). Indeed, as we saw in SHHS1, there are clearly some individuals for whom both EEG channels were flipped, as well as some individuals for whom only one channel was flipped. In other words, we cannot rely on cross-channel correlations alone to indicate whether a given channel is flipped.
Furthermore, what would one do in the case of a sample that only had a single EEG channel available? For example, we didn't consider the MESA study in the analyses above, because it didn't have a C3 channel. What does the distribution of SO phase at spindle peak look like in MESA?
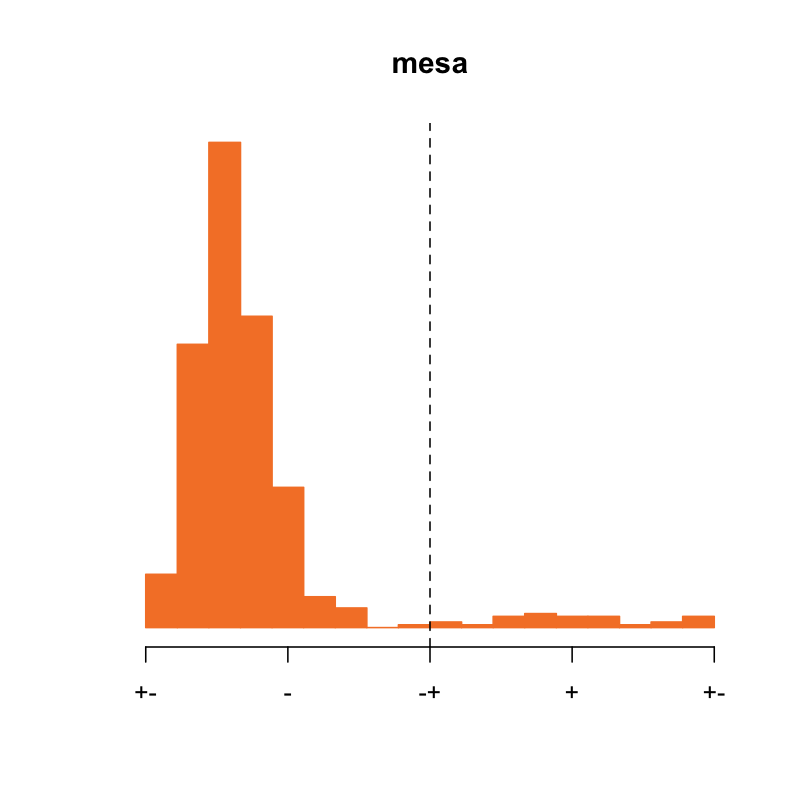
Hmmmm... here it seems that almost all individuals are showing the
unexpected, "flipped" spindle/SO phase distribution, which we've
previously shown is consistent with a flipped channel. In the case of
MESA, I was able to see the pre-NSRR EDFs, and confirm that the
aforementioned edf-translator-tool issue was the culprit, and that
in this case it impacted every EDF in MESA. Thus, for MESA the fix
is easy: one must flip the polarity of all EEG channels (this is for
the EEG3 channel, which is C4-M1).
For the other samples, short of re-processing from scratch (which is, of course, the ultimate solution), is there anything we can do to complement the insights from spindle/SO coupling? Given that spindle/SO coupling is, in itself, a trait of considerable neurophysiological interest, it might understandably make one a bit squeamish to "fix" the signals on the basis of the "expected" result for a likely predictor/outcome variable (especially as we know we don't expect to see an unambiguous signal for everybody in any case...).
Single-channel polarity heuristic
Although far from a perfect fix, here we consider one complementary heuristic to flag potentially flipped EEG signals, that is independent of spindle/SO coupling per se, and is self-contained in the sense that it only looks at one signal at a time. The basic idea is to take advantage of the fact that slow oscillations during NREM sleep tend to be asymmetric, with sharper negative than positive peaks. Rather than detect slow oscillations explicitly (which is certainly possible, and would likely yield similar or even better results), we implemented a slightly different approach (that may or may not have any advantages relative to other similar ideas), as follows. Consider an example epoch of EEG from NREM sleep:
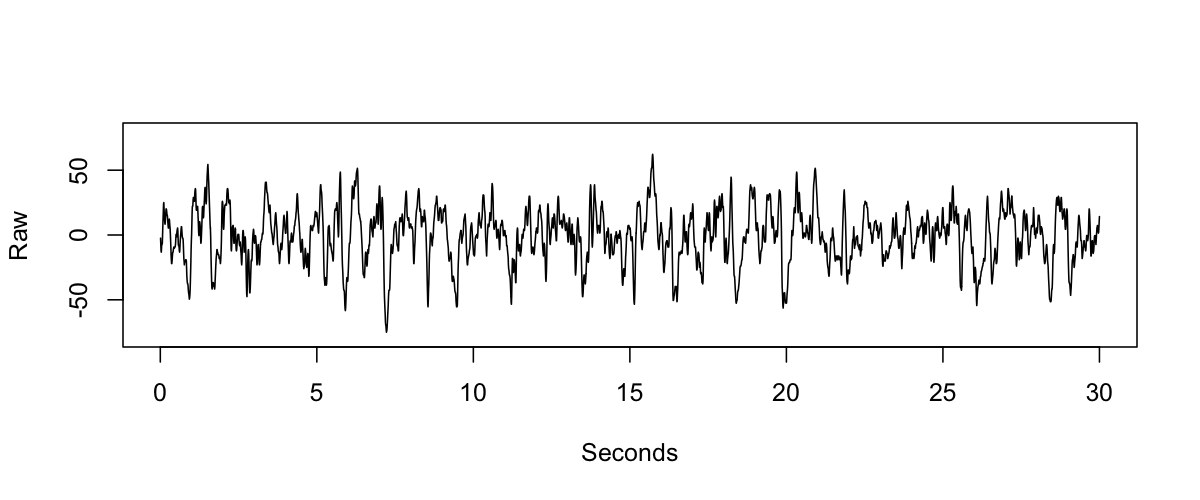
We first standardize the signal, band-pass filter in the delta-band, and then identify all positive (red) versus negative (blue) sample-points:
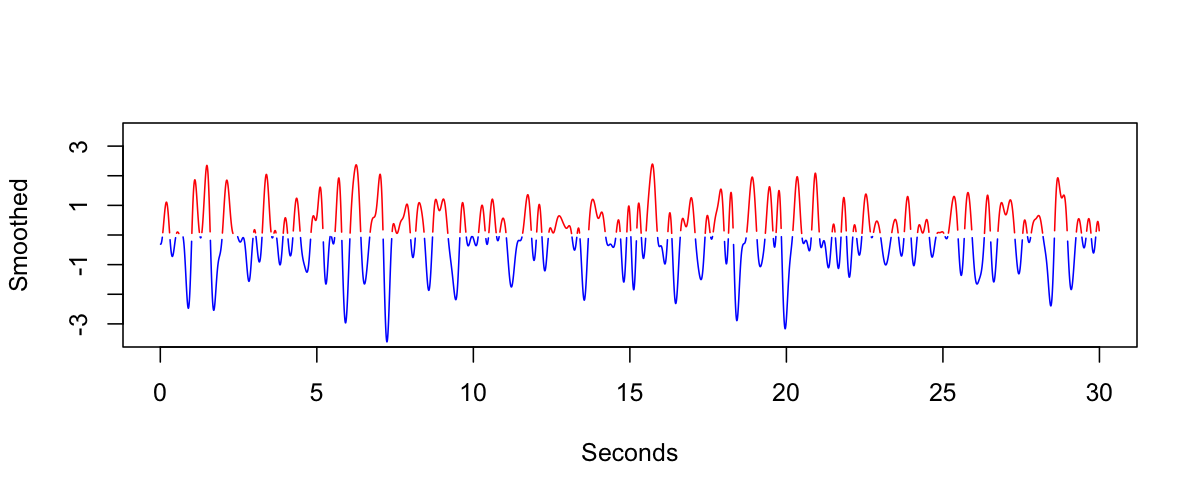
We then identify the even/odd positive components (labeling them red and orange), and we do the same for the negative components (blue and black):
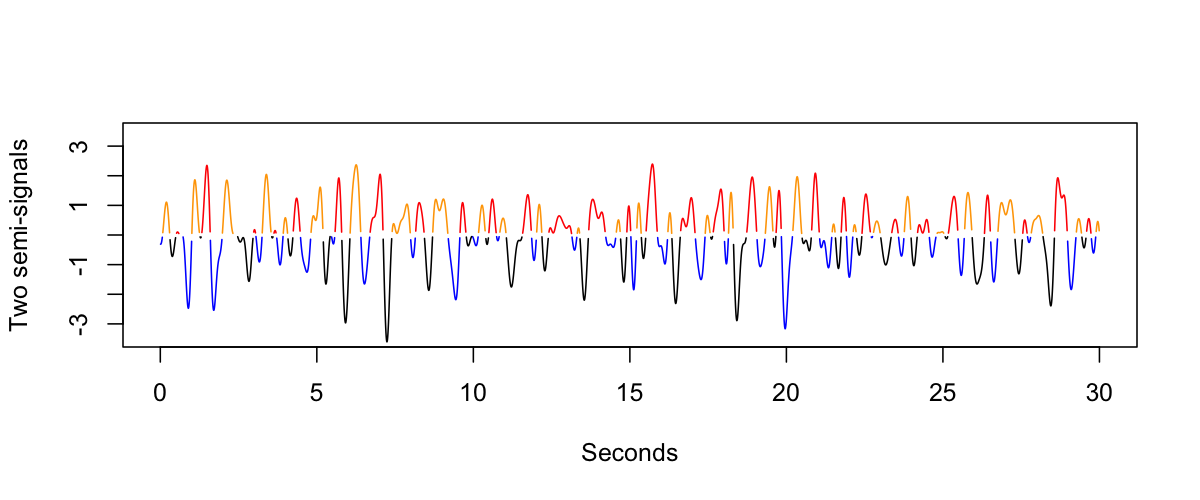
Next, we split the original signal into two semi-signals, corresponding to the upper and lower portions of the original signal. We flip the polarity of odd (i.e. orange/black) components within each semi-signal, in order to create two new signals, as follows:
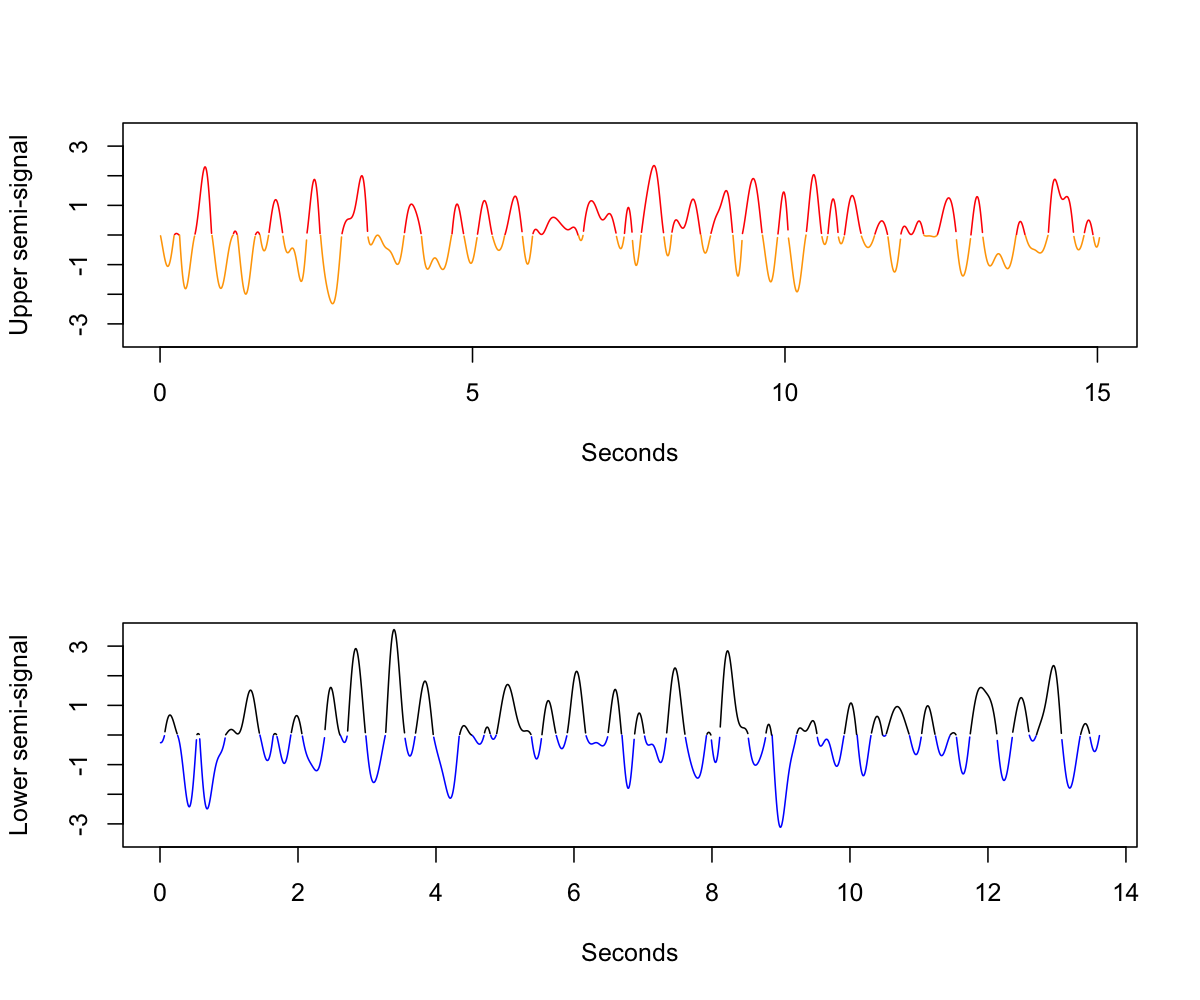
The fundamental idea is that if the original signal is completely "symmetric", then the two resulting semi-signals should have similar spectral properties, both to each other and to the original (filtered) signal. Inasmuch as the original signal has systematic differences in the positive or negative peaks, then we'd expect differences between the two semi-signals, in terms of their spectral (or other) properties.
In this particular illustrative case, we've taken all positive and
negative components, but in practice the method (implemented in the
POL command) only considers
peaks that are at least some threshold (e.g. 1 SD) above or below the
mean. There are a bunch of other options that can be tweaked also,
but describing these is beyond the scope of this vignette. In this
example, we use the difference in the semi-signal Hjorth parameters as
a measure of asymmetry (averaged over all NREM epochs for each
individual).
The plots below show the mean difference in spectral power for the upper versus the lower semi-signal, calculated across all NREM epochs and all individuals in each cohort:
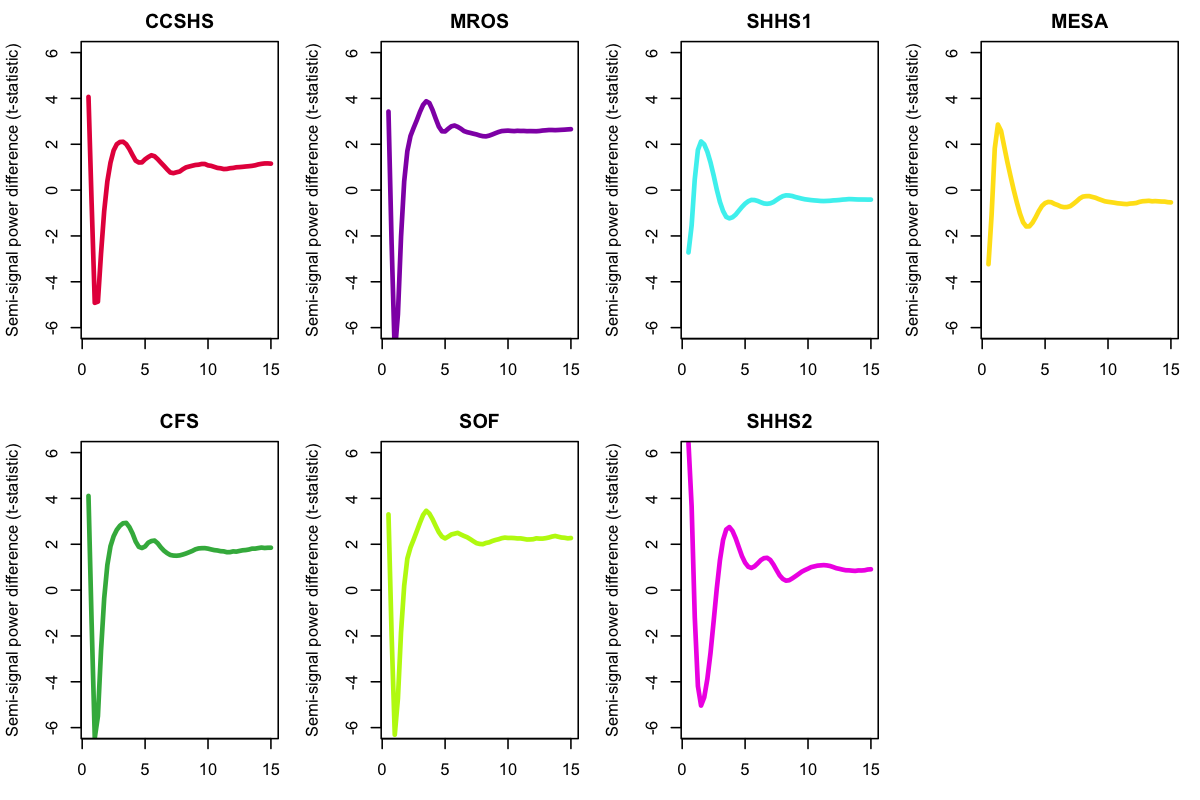
For the cohorts where we do not suspect any EEG polarity flips (i.e. SHHS2, MrOS and SOF, based on the correlational analyses as well as the spindle/SO coupling), we see a characteristic downward dip around 2 Hz in these spectra difference plots, indicative of the more pronounced negative peaks associated with slow oscillations and slow wave activity in general. In contrast, for MESA (where we know every record was flipped) we see the opposite pattern. From the spindle/SO analyses above, we might suspect that most SHHS1 individuals have a flipped C4 channel, and we do indeed see an average profile that is indicative of a flipped signal.
The above plots are looking at sample averages, however. Can these statistics be used to indicate individual-by-individual whether or not a signal was flipped? Below we super-impose the difference statistics for each individual within each cohort:
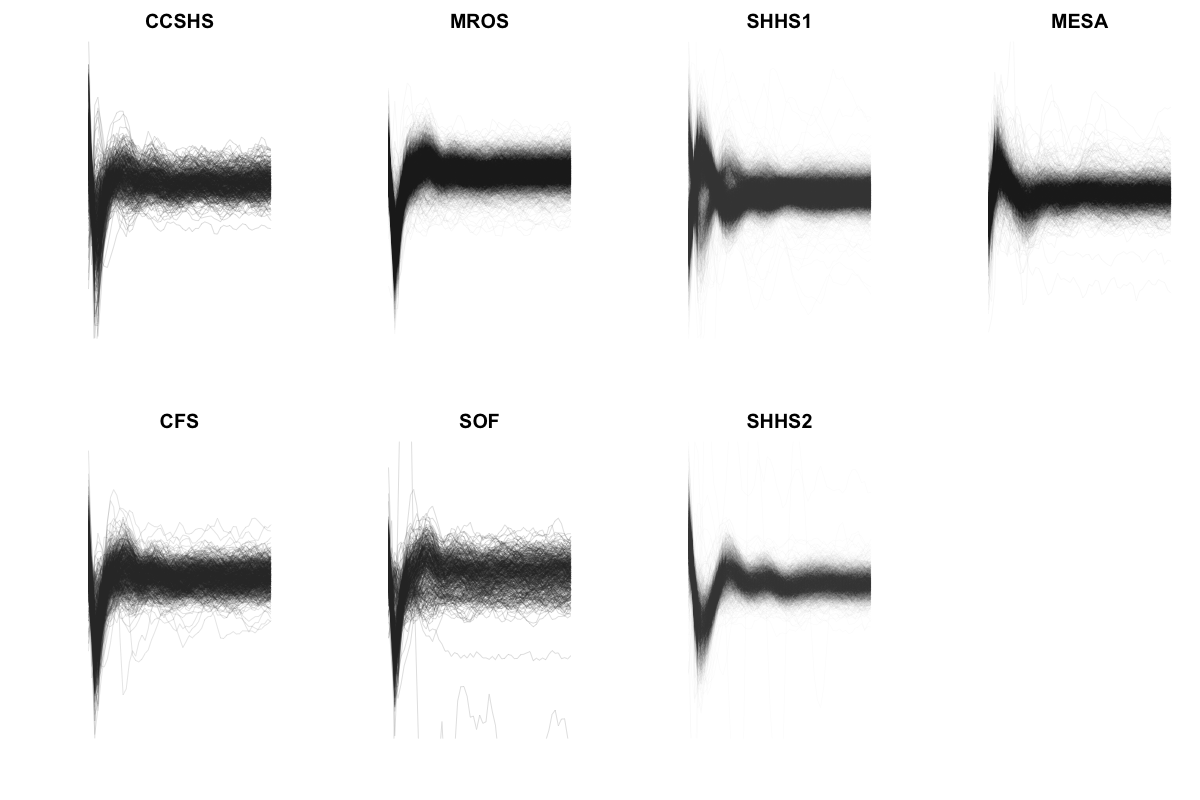
The individual traces are a little hard to make out, but in SHHS1 there is clear evidence for both types of profile, i.e. indicative of some individuals being swapped. For each individual, instead of looking at semi-signal power spectra differences, we can calculate the difference in Hjorth parameters between upper and lower semi-signals, as an index of asymmetry. These correlate highly with both EEG-EOG correlations (e.g. r = 0.72 in SHHS1 and the spindle/SO phase metric (r = 0.83). In fact, in a regression of the spindle/SO metric for all 15,048 individuals on the three semi-signal difference Hjorth parameters (with study as a dummy-coded covariate), we find highly significant associations of all three metrics (p << 10-15, p << 10-15 and p = 10-8 respectively).
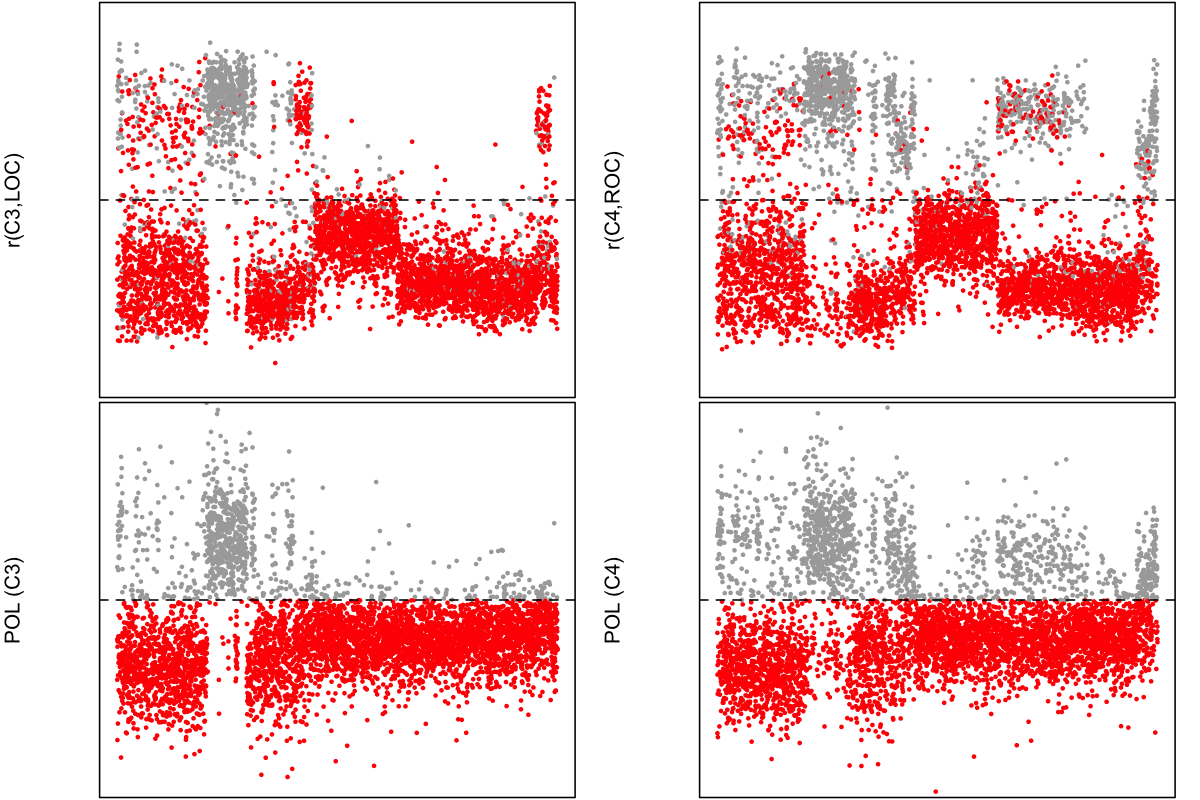
We'll combine the three Hjorth parameter difference scores for each individual, as they are nonetheless quite highly correlated, such that a total score is scaled to indicate a likely polarity flip (a negative score). For SHHS1 individuals only, here we plot the original EEG-EOG correlations and these new POL scores, for C3 (left column) and C4 (right column). Within channel, individuals with a negative POL score are coloured red. Bearing in mind that some of the EOG channels may themselves be flipped (i.e. which will attenuate this relationship), we can see a clear correspondence between the POL score and how EEG and EOG were correlated.
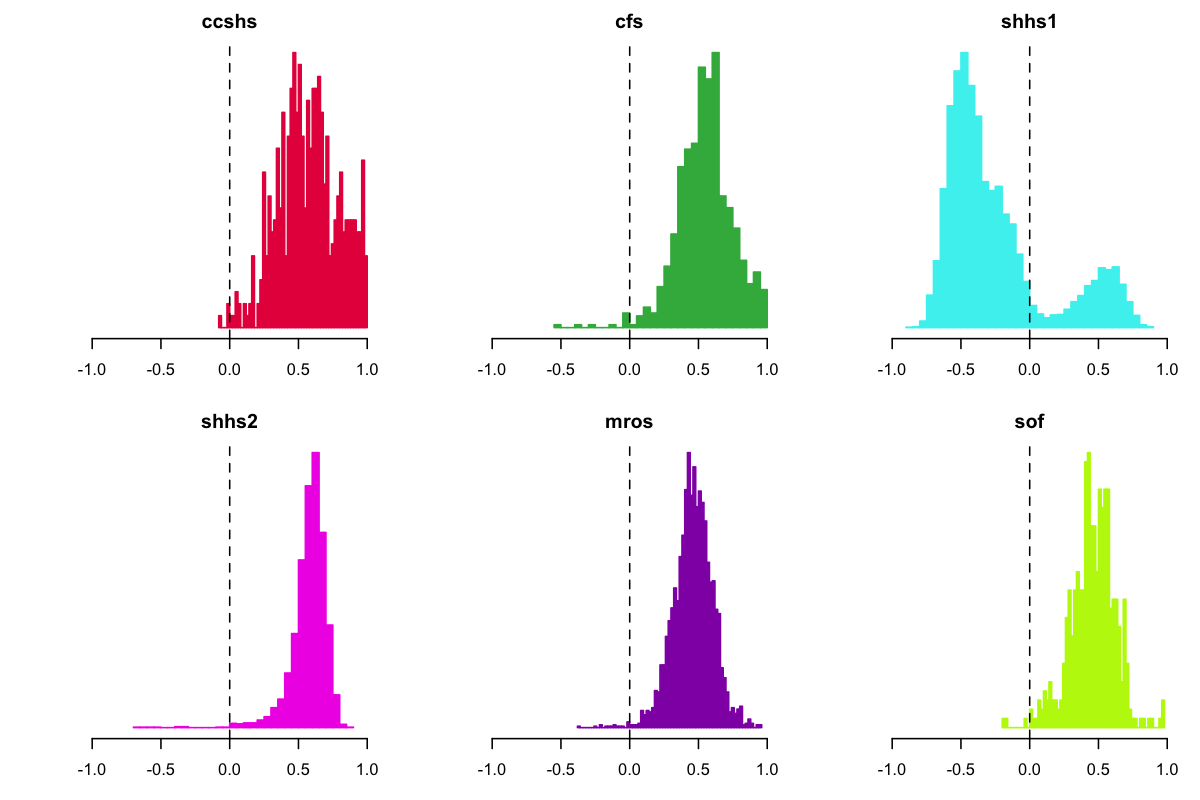
Do the POL scores help to clear up the CFS and CCSHS data in terms of the spindle/SO phase relationships? Here, we phase-shift (180 degrees) individuals with a negative POL score:
This seems to be going in the right direction, although it isn't perfect. For SHHS1, we seem to do better using the POL score compared to the EEG-EOG correlations, as above. This also seems to reduce the issue in CCSHS and CFS, where it appears likely that the EOG signals were flipped as well as the EEG.
Summary
We wanted to flag an issue with some of the NSRR EEG (and other) signals, in which the polarity of certain signals has been flipped. This most obviously impacts SHHS1, because there appears to have been inconsistent flipping of polarities for different signals within the same individual, which makes the issue easier to spot. Based on looking at spindle/SO coupling, and at asymmetries in slow wave activity in the NREM EEG, it appears that subsets of other studies (i.e. here CCSHS, CFS and MESA) were also affected, although it was less obvious because it seems that EEG and EOG channels were consistently flipped (or not flipped) within an individual. This would just come down to how the recording and EDF export was calibrated for a particular study.
For many analyses this issue will not matter at all, although for some analyses it will matter greatly, as shown above. Fixing the data is the ultimate solution. But, acknowledging that this might not always be immediately possible, the types of approaches outlined here would seem to offer a reasonable sanity-check, at least on the whole-sample level. These approaches appear to fall short of unambiguously resolving issues on an individual-by-individual basis, however, and so care is needed if performing analyses where phase/polarity matters. Perhaps conservatively removing individuals with ambiguous (i.e. near zero) POL scores is one approach. The performance of POL is unfortunately likely to vary as a function of real differences in the sleep EEG, i.e. if slow wave activity is attenuated.
If you know of another, easier or more powerful approach, please let us know!
Luna command script used
For reference, here is the Luna command script used to generate the metrics that all the above analyses were based on:
EPOCH epoch=30 require=10

MASK all
MASK unmask-if=NREM2
MASK unmask-if=NREM3
MASK mask-if=${artifact}
MASK mask-if=${arousal}

RESTRUCTURE

EPOCH epoch=30 require=10

uV signal=${eeg},${eog}

RESAMPLE sig=${eeg} sr=100

ARTIFACTS mask signal=${eeg}

SIGSTATS mask threshold=3,3,3 signal=${eeg},${eog}

RESTRUCTURE

EPOCH epoch=30 require=10

% set flim to include spindle/SW range
POL sig=${eeg} flim=15

SPINDLES sig=${eeg} fc=15 sw q=0.3 f-lwr=0.3 f-upr=4 uV-neg=-40 uV-p2p=75 t-neg-lwr=0.3 t-neg-upr=1.5 t-pos-lwr=0 t-pos-upr=1

% need to ensure same SR
CORREL sig=${eeg},${eog} sr=100