lunaR : example usage
Here, we will briefly step through some of the same steps of the
tutorial using lunaR
instead of luna. See also this tutorial page for a
fuller application of lunaR to the tutorial data.
We assume that you are running R and the current working directory is
the one where tutorial.zip was unzipped.
library(luna)
Attach the sample-list with lsl():
sl <- lsl("s.lst")
3 observations in s.lst
Attach just the second individual, nsrr02, with lattach():
lattach( sl , "nsrr02" )
nsrr02 : 14 signals, 10 annotations, 09:57:30 duration
We will then use sequential leval() commands, to restrict
analysis to N2 epochs only, band-pass filter the EEG signal,
automatically scan for epochs with high levels of artifact, and then
estimate the PSD. First, we mask out all epochs that are not N2 sleep:
leval( "MASK ifnot=N2" )
nsrr02 : 14 signals, 10 annotations, 09:57:30 duration, 399 unmasked 30-sec epochs, and 796 masked
leval( "RE" )
nsrr02 : 14 signals, 10 annotations, 03:19:30 duration, 399 unmasked 30-sec epochs, and 0 masked
leval( "SIGNALS keep=EEG" )
nsrr02 : 1 signals, 10 annotations, 03:19:30 duration, 399 unmasked 30-sec epochs, and 0 masked
leval( "FILTER bandpass=0.3,35 ripple=0.02 tw=0.5" )
Next, we scan for artifacts. Note, for the prior leval() commands,
we have not been explicitly saving any returned values, as the prior
commands typically do not return values of interest. Here we will
save return values (in a list named k0) for future use, however:
k0 <- leval( "ARTIFACTS mask & CHEP-MASK ep-th=3,3,3 & CHEP epochs" )
nsrr02 : 1 signals, 10 annotations, 03:19:30 duration, 368 unmasked 30-sec epochs, and 31 masked
We see that 31 epochs have been masked (out of 399). You can examine
the returned k0 list (with lx() or just directly), to see
the other output of these commands. We next restructure the dataset one
more time to remove these masked epochs:
leval( "RE" )
nsrr02 : 1 signals, 10 annotations, 03:04:00 duration, 368 unmasked 30-sec epochs, and 0 masked
PSD command, with the spectrum option:
k <- leval( "PSD spectrum max=30" )
lx(k)
PSD : CH B_CH CH_F
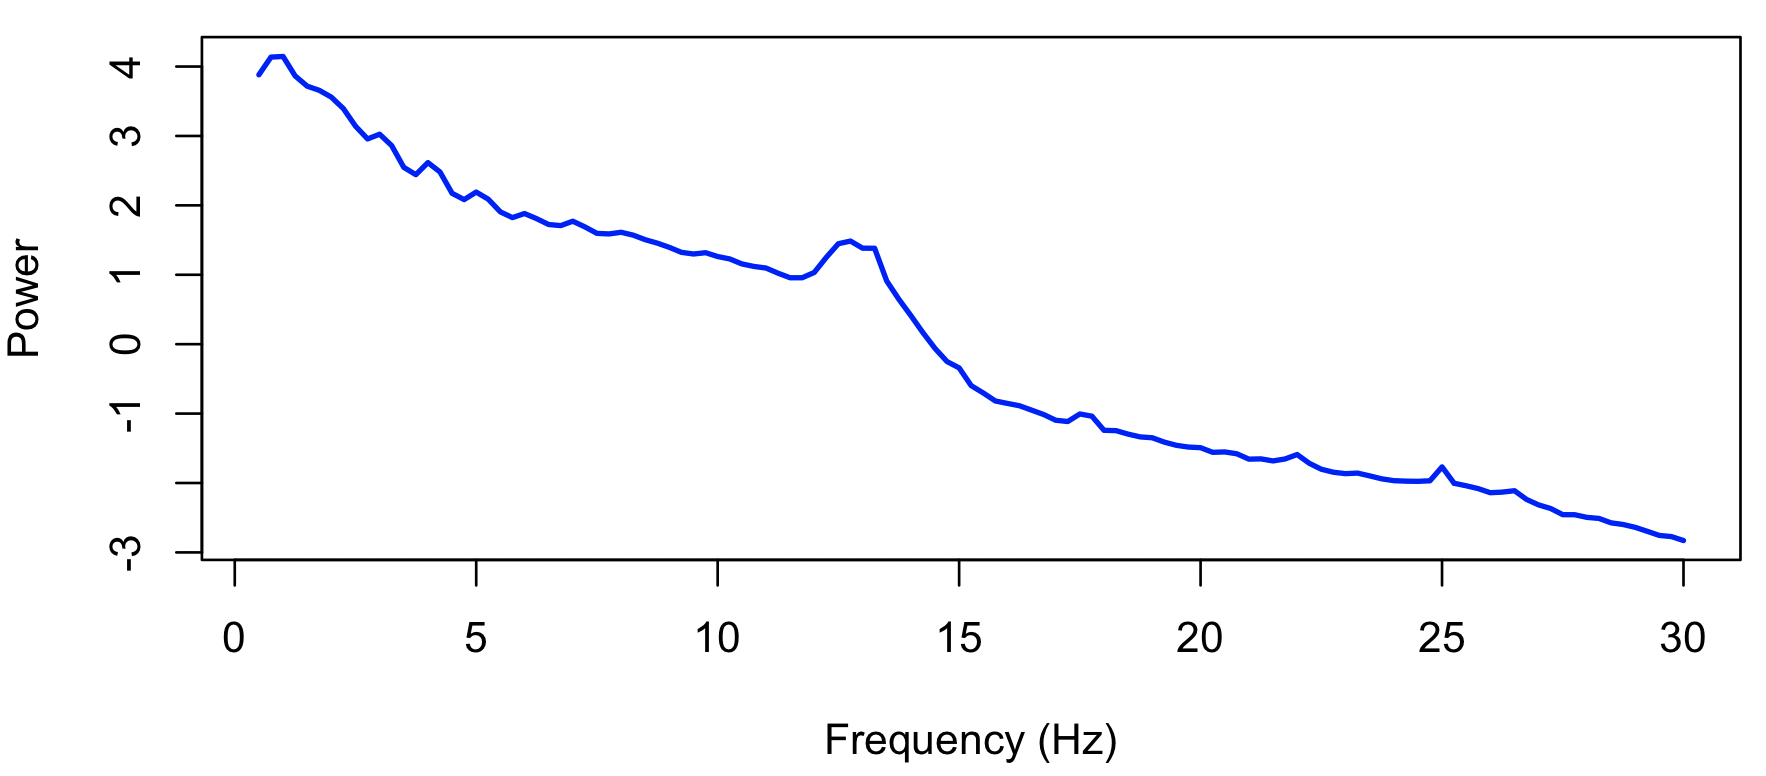
Of primary interest, is spectral power (PSD variable) stratified by
frequency (F) and channel (CH, although note that in this
particular analysis we only have a single channel, EEG):
k$PSD$CH_F
        ID  CH     F         PSD
1   nsrr02 EEG  0.50 48.48646744
2   nsrr02 EEG  0.75 62.55672251
3   nsrr02 EEG  1.00 63.13289104
4   nsrr02 EEG  1.25 47.72029434
5   nsrr02 EEG  1.50 41.14412948
6   nsrr02 EEG  1.75 38.76472567
7   nsrr02 EEG  2.00 35.13171657
8   nsrr02 EEG  2.25 29.76887124
9   nsrr02 EEG  2.50 23.13801428
10  nsrr02 EEG  2.75 19.24464783
11  nsrr02 EEG  3.00 20.59488426
12  nsrr02 EEG  3.25 17.46907997
13  nsrr02 EEG  3.50 12.77704547
14  nsrr02 EEG  3.75 11.49771701
15  nsrr02 EEG  4.00 13.68299939
16  nsrr02 EEG  4.25 11.95281293
17  nsrr02 EEG  4.50  8.79124308
18  nsrr02 EEG  4.75  8.02781760
19  nsrr02 EEG  5.00  8.94853303
20  nsrr02 EEG  5.25  8.07366985
21  nsrr02 EEG  5.50  6.72716982
22  nsrr02 EEG  5.75  6.19444000
23  nsrr02 EEG  6.00  6.56810384
24  nsrr02 EEG  6.25  6.10237343
25  nsrr02 EEG  6.50  5.60697017
...
d <- k$PSD$CH_F
plot( d$F , log(d$PSD) , xlab = "Frequency (Hz)" , ylab = "Power" , col="blue" , lwd=2 , type="l" )
That completes our simple introduction to using lunaR. As noted above, see the final tutorial page for a fuller set of examples of using lunaR. The next page contains reference documentation for each lunaR function.