Using Luna for automated artifact removal from high-density EEG
Some new features recently added to Luna provide a relatively easy workflow for handling high-density EEG recordings, with a focus on artifact detection and cleaning.
These include:
- detection of outlier epochs and/or channels
- interpolation or removal of bad epochs and/or channels
- ICA for artifact detection
In this vignette, we illustrate the first two of these features, showing an example data-cleaning workflow (along with scripts for visualization) as applied to a hdEEG sleep study.
Initial raw data
We will use a 57-channel EEG dataset that combines manually-scored N2 and N3 sleep stages (in 30-second epochs). These EEG data are referenced to linked mastoids and have been previously band-pass filtered 0.3-35 Hz and downsampled to 100 Hz.
| ZIP archive (180.7Mb) containing the EDF can be downloaded here |
|---|
| http://zzz.bwh.harvard.edu/dist/luna/chep-vig.zip |
After downloading and unzipping the data, we can check the list of channels,
length of the recording, the sampling rate
with DESC command:
luna Subj1.edf -s DESC
EDF filename      : Subj1.edf
ID                : Subj1.edf
Header start time : 21.30.23
Last observed time: 06.03.22
Duration          : 04:51:00
# signals         : 57
# EDF annotations : 1
Signals           : Fp1[100] Fp2[100] AF3[100] AF4[100] F7[100] F5[100]
                    F3[100] F1[100] F2[100] F4[100] F6[100] F8[100]
                    FT7[100] FC5[100] FC3[100] FC1[100] FC2[100] FC4[100]
                    FC6[100] FT8[100] T7[100] C5[100] C3[100] C1[100]
                    C2[100] C4[100] C6[100] T8[100] TP7[100] CP5[100]
                    CP3[100] CP1[100] CP2[100] CP4[100] CP6[100] TP8[100]
                    P7[100] P5[100] P3[100] P1[100] P2[100] P4[100]
                    P6[100] P8[100] PO3[100] PO4[100] O1[100] O2[100]
                    AFZ[100] FZ[100] FCZ[100] CZ[100] CPZ[100] PZ[100]
                    POz[100] OZ[100] FPZ[100]
In general, it is a good practice to look at the raw data before any preprocessing steps, to get an idea about the quality of the data. For this purpose, let's compute Hjorth statistics and the (Welch) PSD using the following command:
luna Subj1.edf -o ss_psd1.db -s 'SIGSTATS epoch & PSD spectrum max=35'
For visualization, we will use the R package and some of the lunaR functions. Using this code, we will plot the PSD from the output of the previous Luna run:
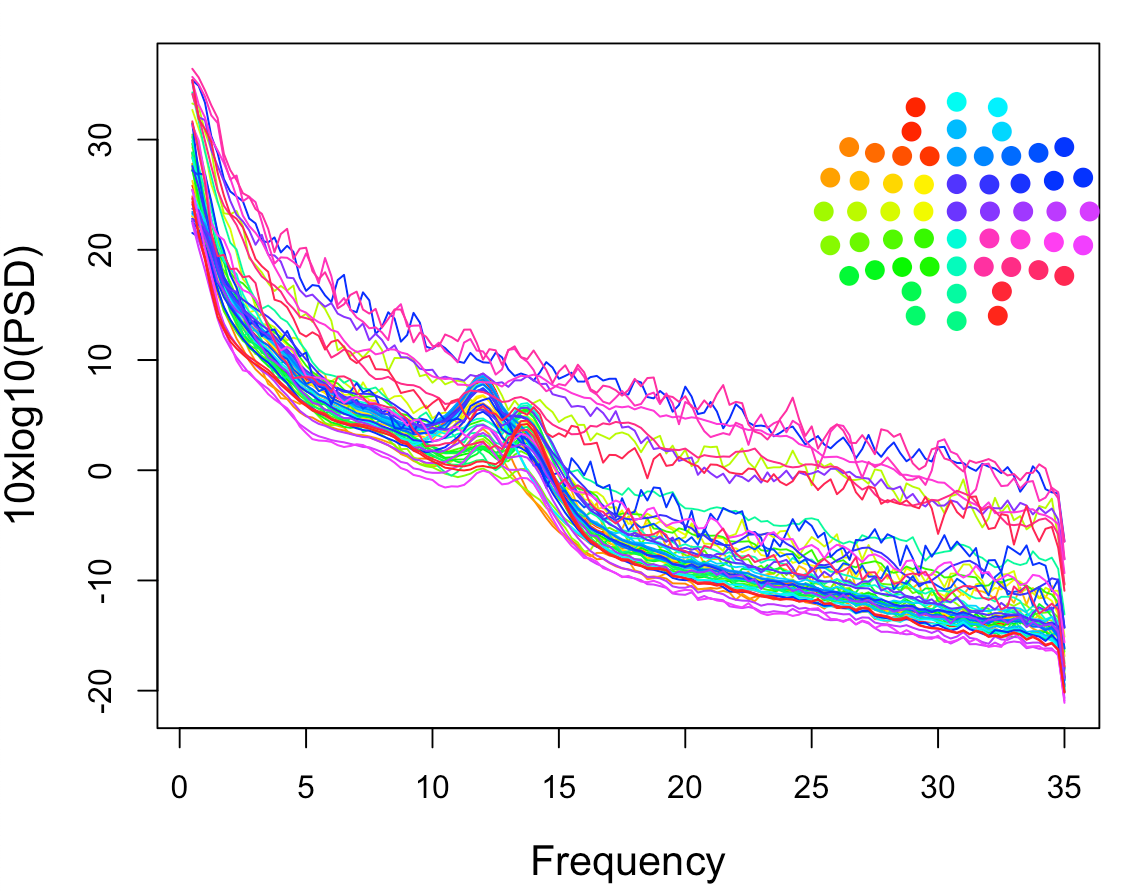
From the plot above, it is clear that there are quite a few noisy channels, and based on the little topoplot in the top-right corner we can approximately tell that most of the noisy channels (different shades of pink) are located in the right hemisphere.
Another way to gain some insight on data quality is to look at
the Hjorth parameters computed with the
SIGSTATS command in the above Luna run. Using
the lheatmap() function, we can visualize the
data using this code:
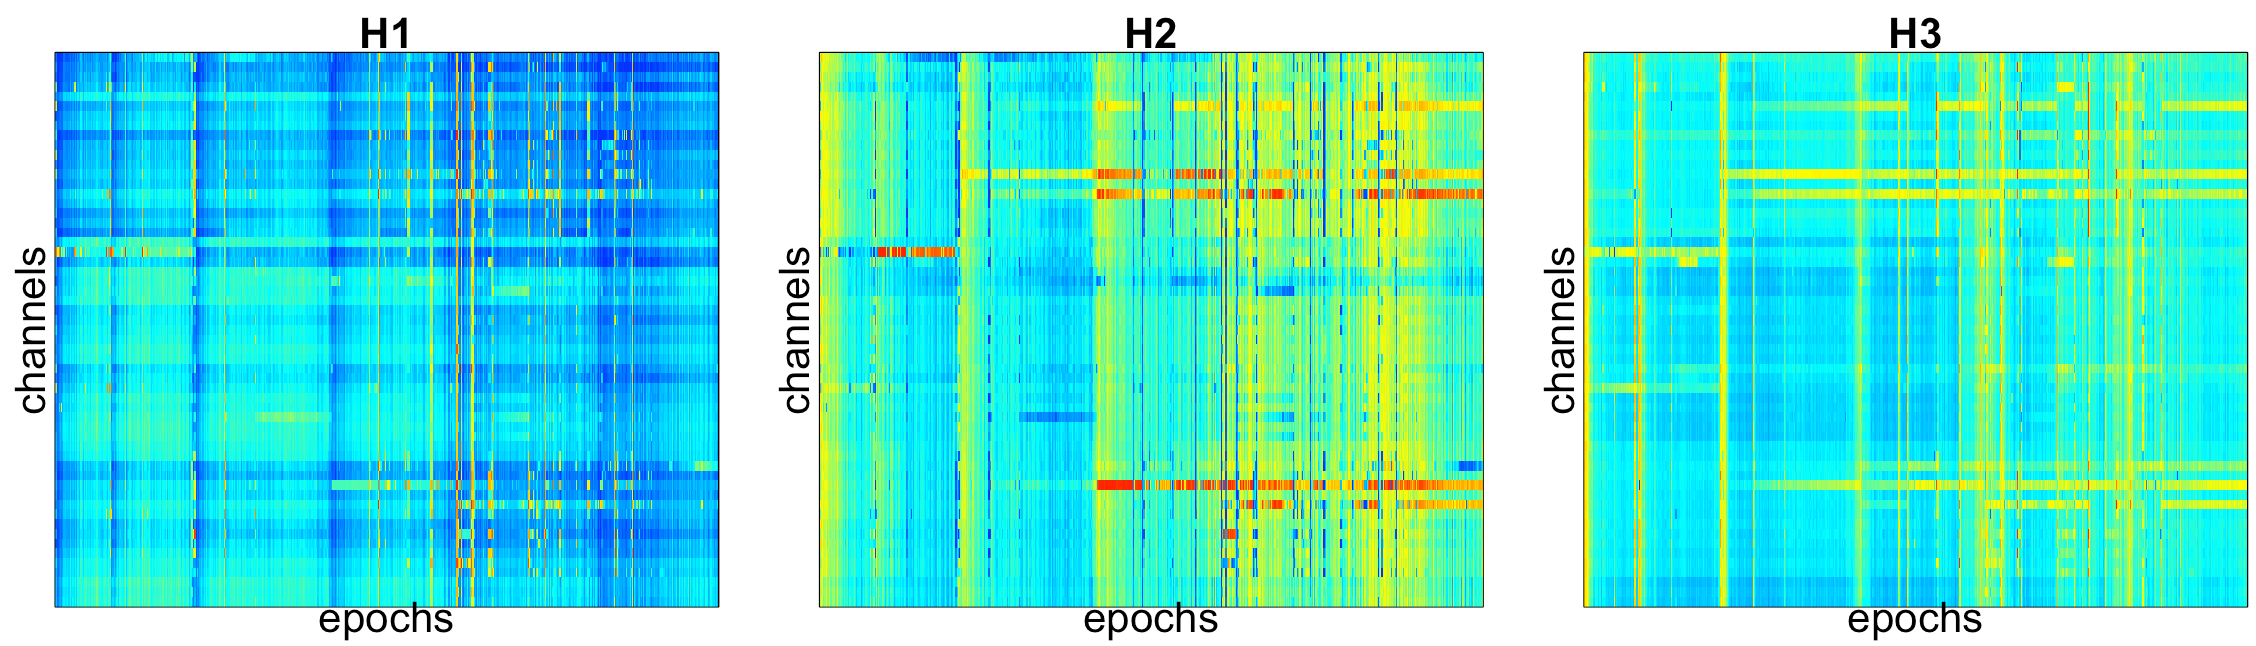
In particular, based on the second Hjorth parameter (H2), it is evident that several channels show unusual patterns in the latter two-thirds of the recording (red horizontal lines). Vertical streaks represent bad epochs, in which many channels showed unusual patterns (e.g. due to movement).
Detecting bad channels
Luna provides a number of ways to detect bad channels, based on
different criteria such as a lack of correlation with other channels
(CORREL), low predictability of a channel based on other channels
(L1OUT), or being an outlier based on Hjorth parameters with respect
to other epochs. In this vignette, we will focus on the latter
approach due to its simplicity and efficiency.
The full process involves four Luna commands:
CHEP-MASK- to compute Hjorth (or other) statistics and flag outlier channel/epoch pairsCHEP- to apply the mask generated by the previous command(s), masking epochs and/or channelsCLOCS- to specify channel locations, which are needed byINTERPOLATEINTERPOLATE- to interpolate (via spherical splines) all previously masked epochs
Let's first omit the interpolation component and focus on detecting
bad channels using the CHEP-MASK and CHEP commands. In brief:
CHEP-MASK defines outlier CHannel/EPoch pairs, in one of three ways
-
within-channel, between epochs: the
ep-thoption finds time series that are unusual with respect to all other epochs for that channel (i.e. searching across a row in the matrix plotted below) -
within-epoch, between channels: the
ch-thoption finds time series that are unusual with respect to all other channels for that epoch (i.e. searching across a column) -
between-channels and between-epochs: : the
chep-thoption finds times series that are unusual with respect to all epochs across all channels (i.e. searching the whole matrix)
These three options take one or more standard deviation thresholds as
options, allowing for iterative outlier detection: e.g. ep-th=5,3
means to flag epochs that are 5 SDs away from the mean for any Hjorth
parameter, and then repeats the process (in the cleaned data) by further
marking epochs that are 3-SD outliers. These three options can be
specified together within the same CHEP-MASK command, in which case they will be
performed in the order above.
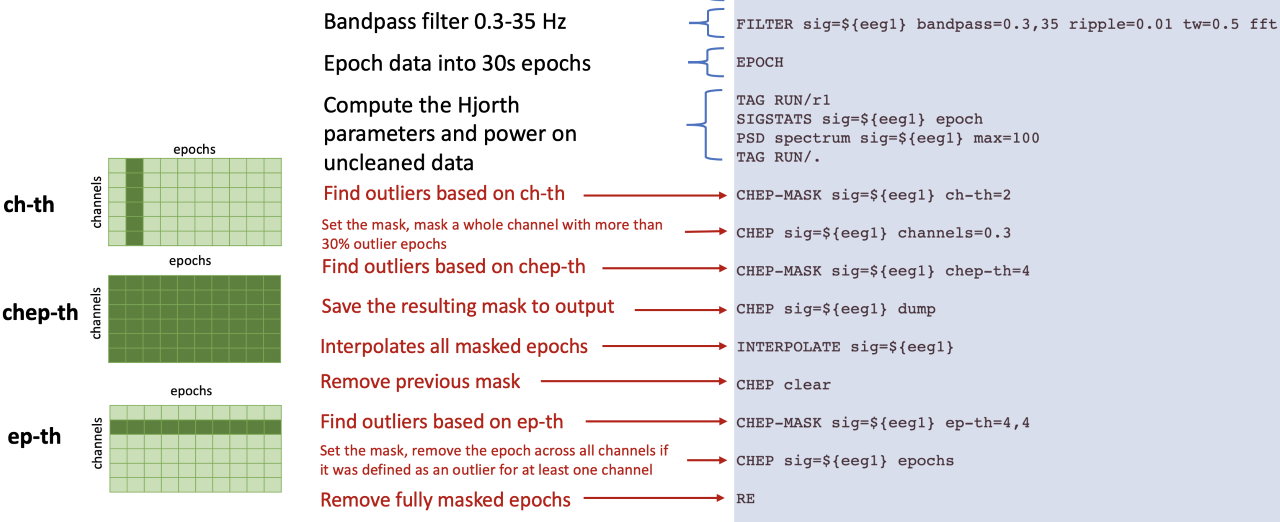
To clarify some of the language used below:
- a channel is a row of this matrix
- an epoch is a column of this matrix
- a chep (CHannel/EPoch pair) is a single cell of this matrix: these are the entities that are flagged by
CHEP-MASK
By itself, the cheps flagged by CHEP-MASK are not recognized by
most Luna commands (e.g. PSD, etc), although there are a few
exceptions: CHEP and INTERPOLATE being the primary ones that are
relevant here. This principle is enforced because Luna expects that
most operations will require that multiple channels all align, in the
sense of corresponding to the same underlying set of epochs. In other
words, we typically want a dataset in which an epoch is either masked
or not, and in which a channel is either present or not. One key role
of the CHEP command is to translate between this internal CHEP
mask, and the dropping of channels and/or epochs from the overall
dataset.
Coming back to our dataset: we'll use
CHEP-MASK command with the option
ch-th=2, meaning that cheps with any of the three Hjorth parameters
exceeding 2 SD with respect to other channels (for that same epoch) will be
defined as outliers. Further, we'll use CHEP to take the
existing CHEP mask (i.e. generated by the CHEP-MASK command) and
flag whole channels if a certain proportion (e.g. 30%) of cheps have
been flagged as outliers. To do this, CHEP is called with the
option channels=0.3 to mark a channel as bad (i.e. mask that channel for all epochs)
if more than 30% of its cheps are outliers. We'll also use the option dump to
save the newly generated mask into the output stream.
luna Subj1.edf -o chep_bchs.db -s 'CHEP-MASK ch-th=2 & CHEP channels=0.3 dump'
Other CHEP functionality
There are other options described here for
CHEP such as loading, saving or clearing CHEP masks, masking epochs,
etc.
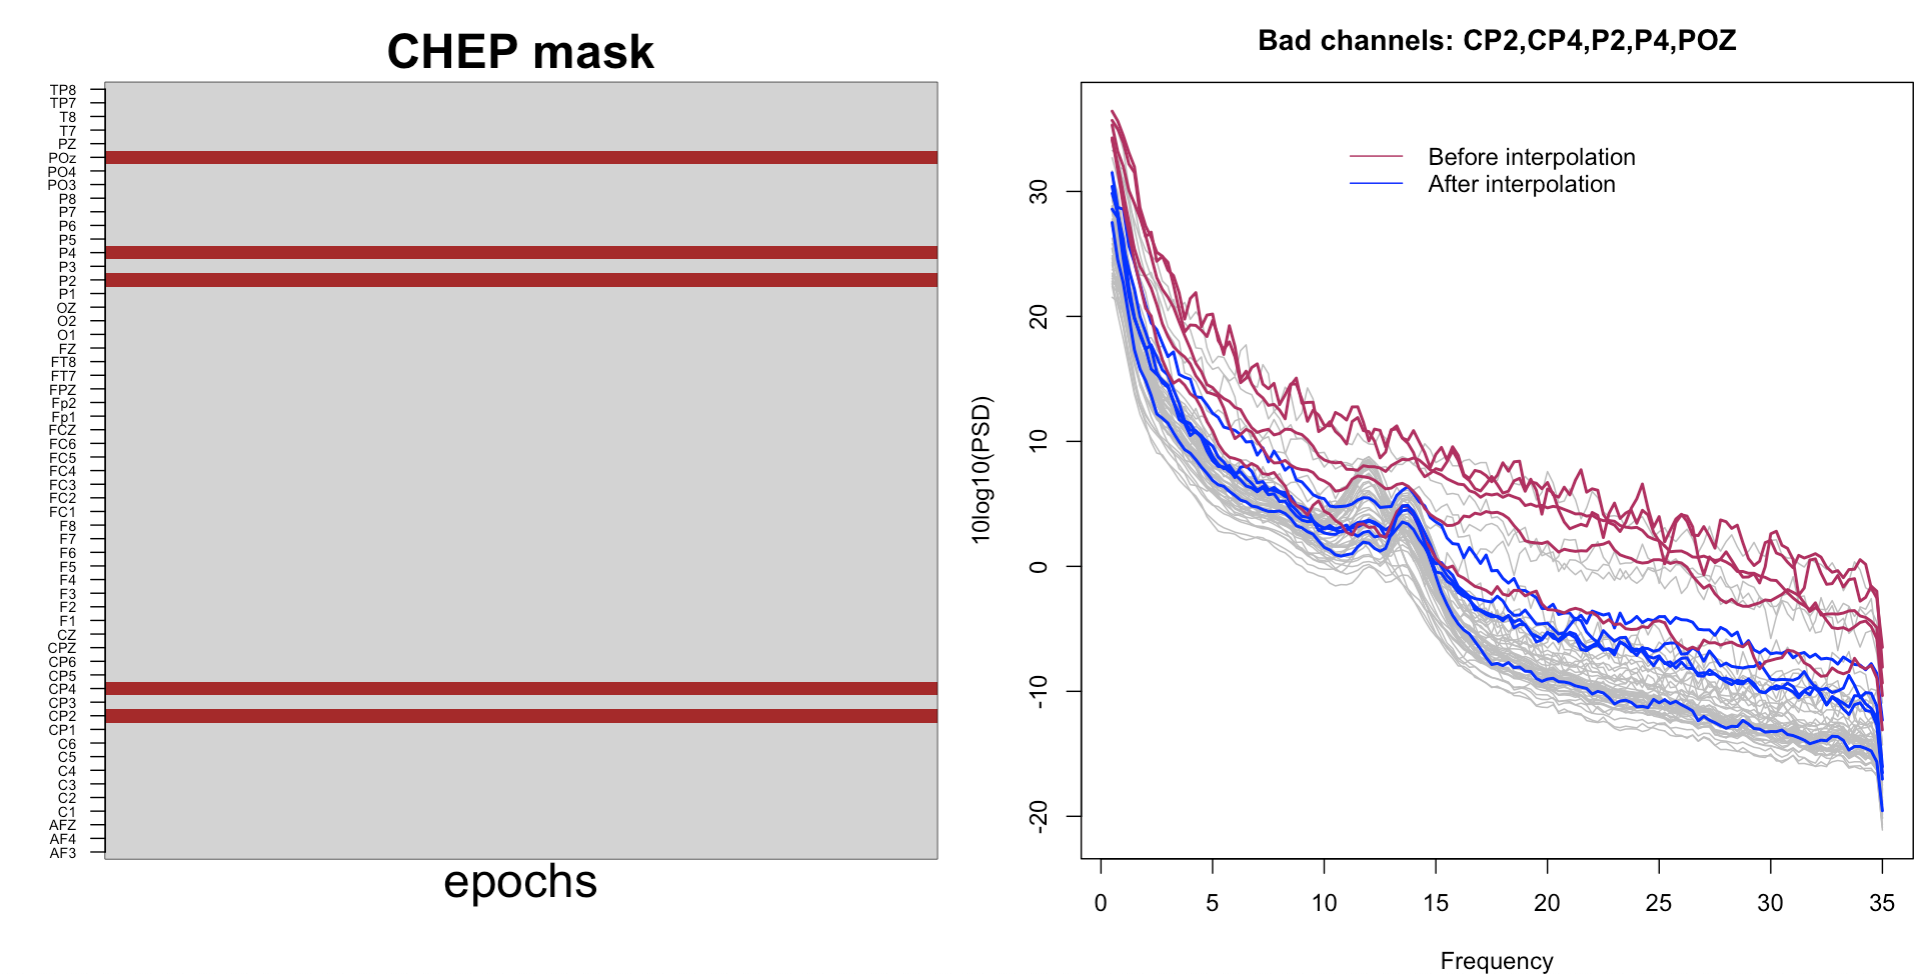
We can now visualize this mask to see which epochs and channels were marked as outliers by running this R script:
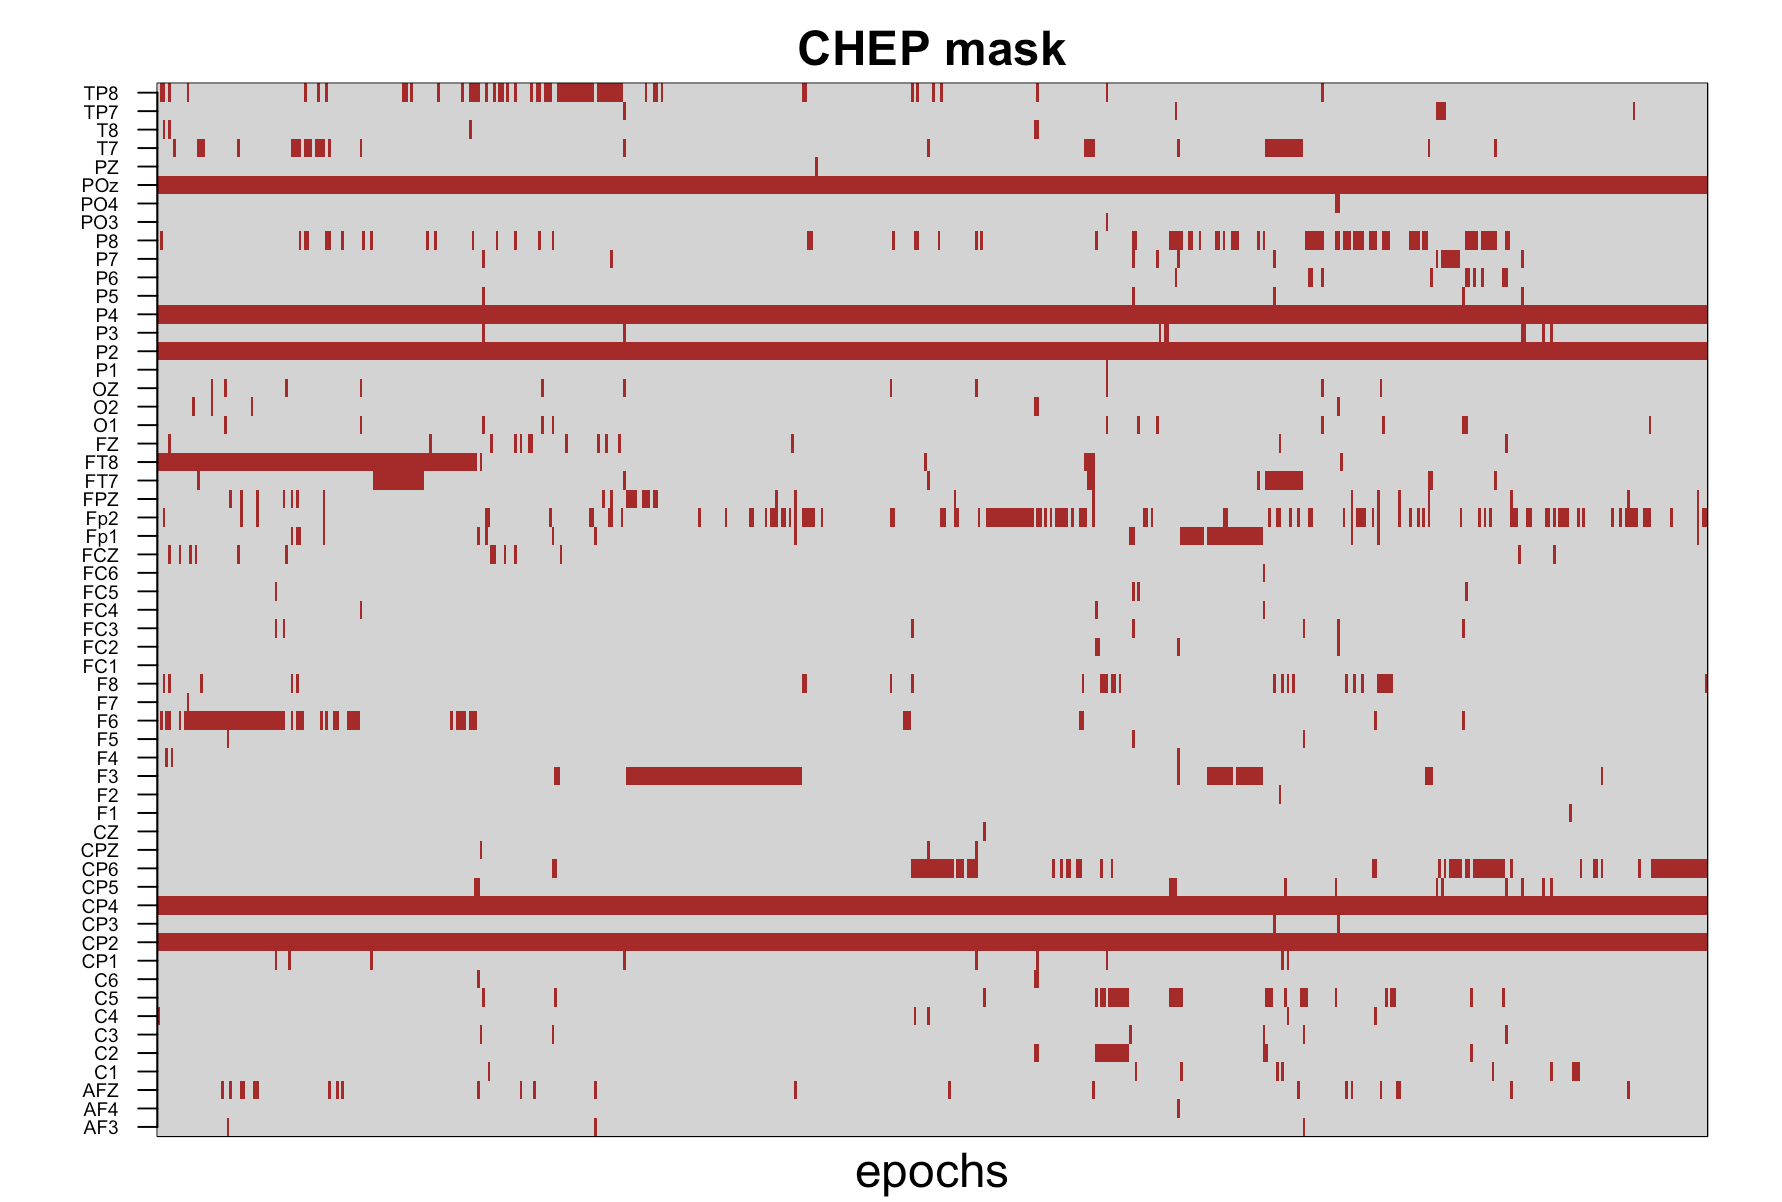
The plot above is a direct illustration of how the CHEP mask works
across channels and epochs, with the dark red color marking the
cheps marked as outliers. It is now apparent that 5 channels were
defined as "bad", with all epochs fully masked out (namely POz, P4, P2,
CP4 and CP2). Also notice that those channels correspond to
the red lines we observed before on the H2 heatmap:
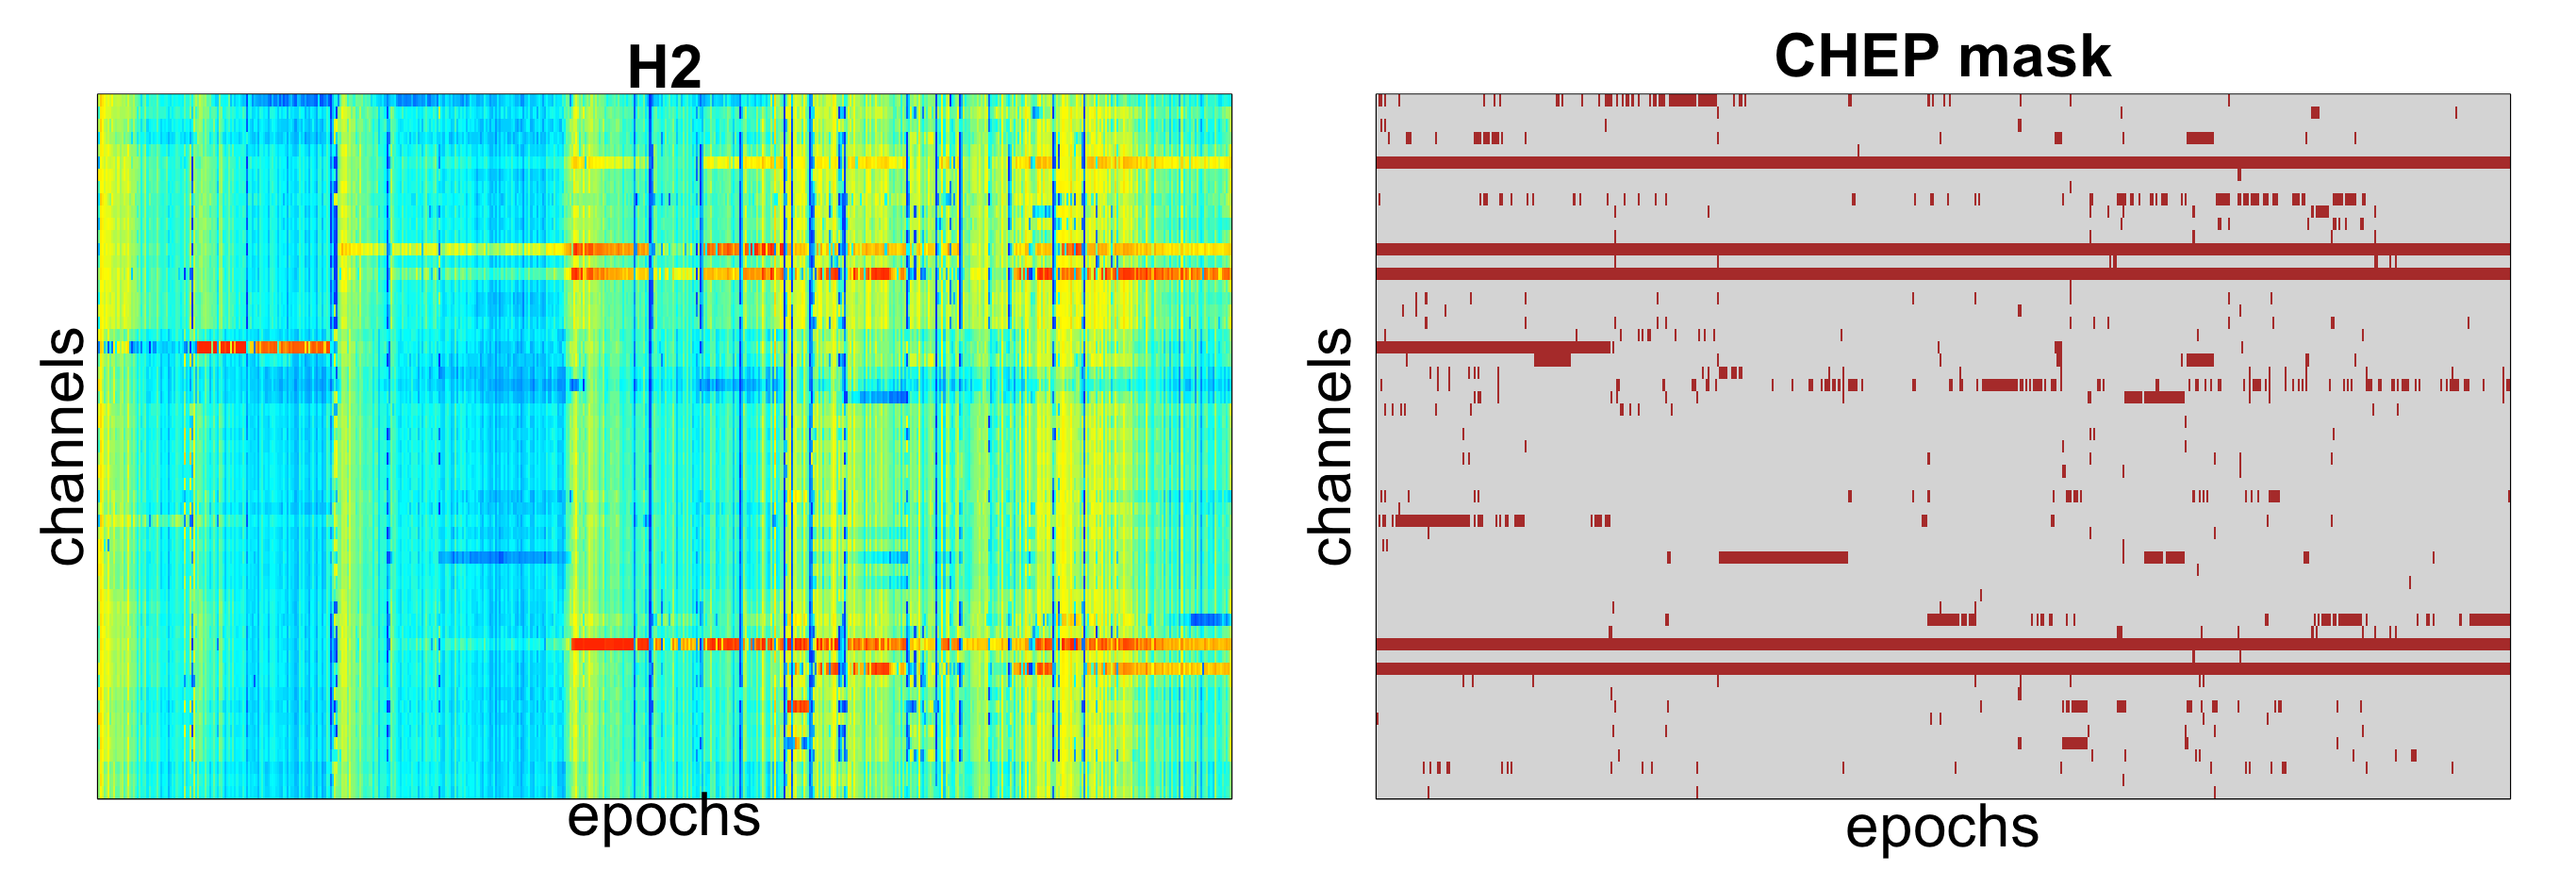
That is, the channels defined as bad had extreme values for the latter part of the recording; further, the number of bad cheps for those channels exceeded our threshold of a maximum 30% and thus were masked out completely.
Interpolation
Note
The INTERPOLATE command needs information about channel locations, which can be attached via the CLOCS command.
Now we will proceed to interpolate bad channels. As well as channel
locations, the INTERPOLATE command requires a valid CHEP mask to
be specified, in order to tell it what to interpolate. One can either
create this in the same run as the interpolation (i.e. the CHEP mask
resides in memory), or if wanting a multi-step approach, it is
possible to save the CHEP mask to a file, and then reload it. To
illustrate these possibilities, we'll adopt this second approach here.
First, we will re-run the CHEP-MASK and CHEP commands to generate a file that contains
the bad channels to be re-interpolated. We'll make two changes to the above Luna commands:
-
using
saveinstead ofdump: this writes a simple text file that can beloaded back into Luna in a subsequent run -
adding the option
black-and-whitewhich modifies the behavior of thechannelscommand: now, as well as "bad" (above threshold) channels having all cheps set to bad, this option will also do the converse: all cheps for "good channels" will be set to good: i.e. a channel is now either "all good" or "all bad". This way, the subsequent interpolation will be operating at a whole-channel level (as described below, Luna's interpolation routine is not constrained to work at the whole-channel level in general).
luna Subj1.edf -o chep_bchs.db -s ' CHEP-MASK ch-th=2
                                  & CHEP channels=0.3 black-and-white save=bad.chep'
Now we will use the text file we just saved from CHEP and reload it
to define the CHEP mask. (As noted above, we could simply have
re-run the CHEP-MASK and CHEP commands in this second run rather
than saving to a file: we are simply illustrating different modes of
operation here, some of which may be more natural in some scenarios.)
We will interpolate the bad channels, and compute
SIGSTATS and PSD once more to make sure that interpolated channels
look broadly acceptable.
luna Subj1.edf -o ss_psd2.db -s ' EPOCH
                                & CLOCS file=clocs
                                & CHEP load=bad.chep dump
                                & INTERPOLATE
                                & SIGSTATS epoch
                                & PSD spectrum max=35'
Using this R code, we can generate the following visualization showing the interpolated channels, and the resulting PSD (compared to beforehand for the bad channels):
Dropping channels instead of interpolating them
If you wished simply to remove the bad channels (instead of interpolating them), then replace INTERPOLATE
with RESTRUCTURE.
Specifying channel labels
By default, Luna will feed all data channels into commands such as CHEP-MASK, CHEP, INTERPOLATE, etc. If the EDF also contains non-EEG channels, or you only want a subset of the EEG
channels to be considered, then add a sig option to any of these commands. For example, if specified, the CHEP command uses the number of channels specified in sig as the denominator
for deciding whether a given epoch should be flagged or not.
Epoch-level interpolation
Based on the PSD above, the bad channels seem to have been interpolated nicely, but are the data really clean enough? We see that there are still many channels with noisy PSD (in grey on the background in the above plot). Should we use a stricter threshold and define more channels as bad? That will potentially result in slightly cleaner data, but at the same time, we will likely end up with a huge proportion of the data final being interpolated, which is naturally undesirable.
This type of trade-off seems particularly relevant for sleep EEG recordings, which are typically very long and so may contain both hours of clean data but also signifcant periods of unusable data. Further, the noisy periods may occur at different times for different channels (meaning that one cannot simply remove a small portion of the recording). Rejecting hours of good EEG data seems wasteful.
To address this, Luna provides an option of interpolating all
outlier cheps and not only whole channels. That is, Luna's
INTERPOLATE command works on an epoch-by-epoch basis, where the
channels being interpolated can vary between epochs (i.e. they are defined
by the appropriate column of the CHEP mask).
As a demonstration, we will now interpolate all the cheps which were
defined as outliers when we first ran CHEP-MASK and CHEP commands (rather than
extracting only a handful of bad channels). The primary difference is that we do not
add the black-and-white option for the CHEP command:
luna Subj1.edf -o ss_psd3.db -s ' CHEP-MASK ch-th=2
                                & CHEP channels=0.3 dump
                                & CLOCS file=clocs
                                & INTERPOLATE
                                & SIGSTATS epoch
                                & PSD spectrum max=35'
Visualizing the resulting PSD (using this R code):
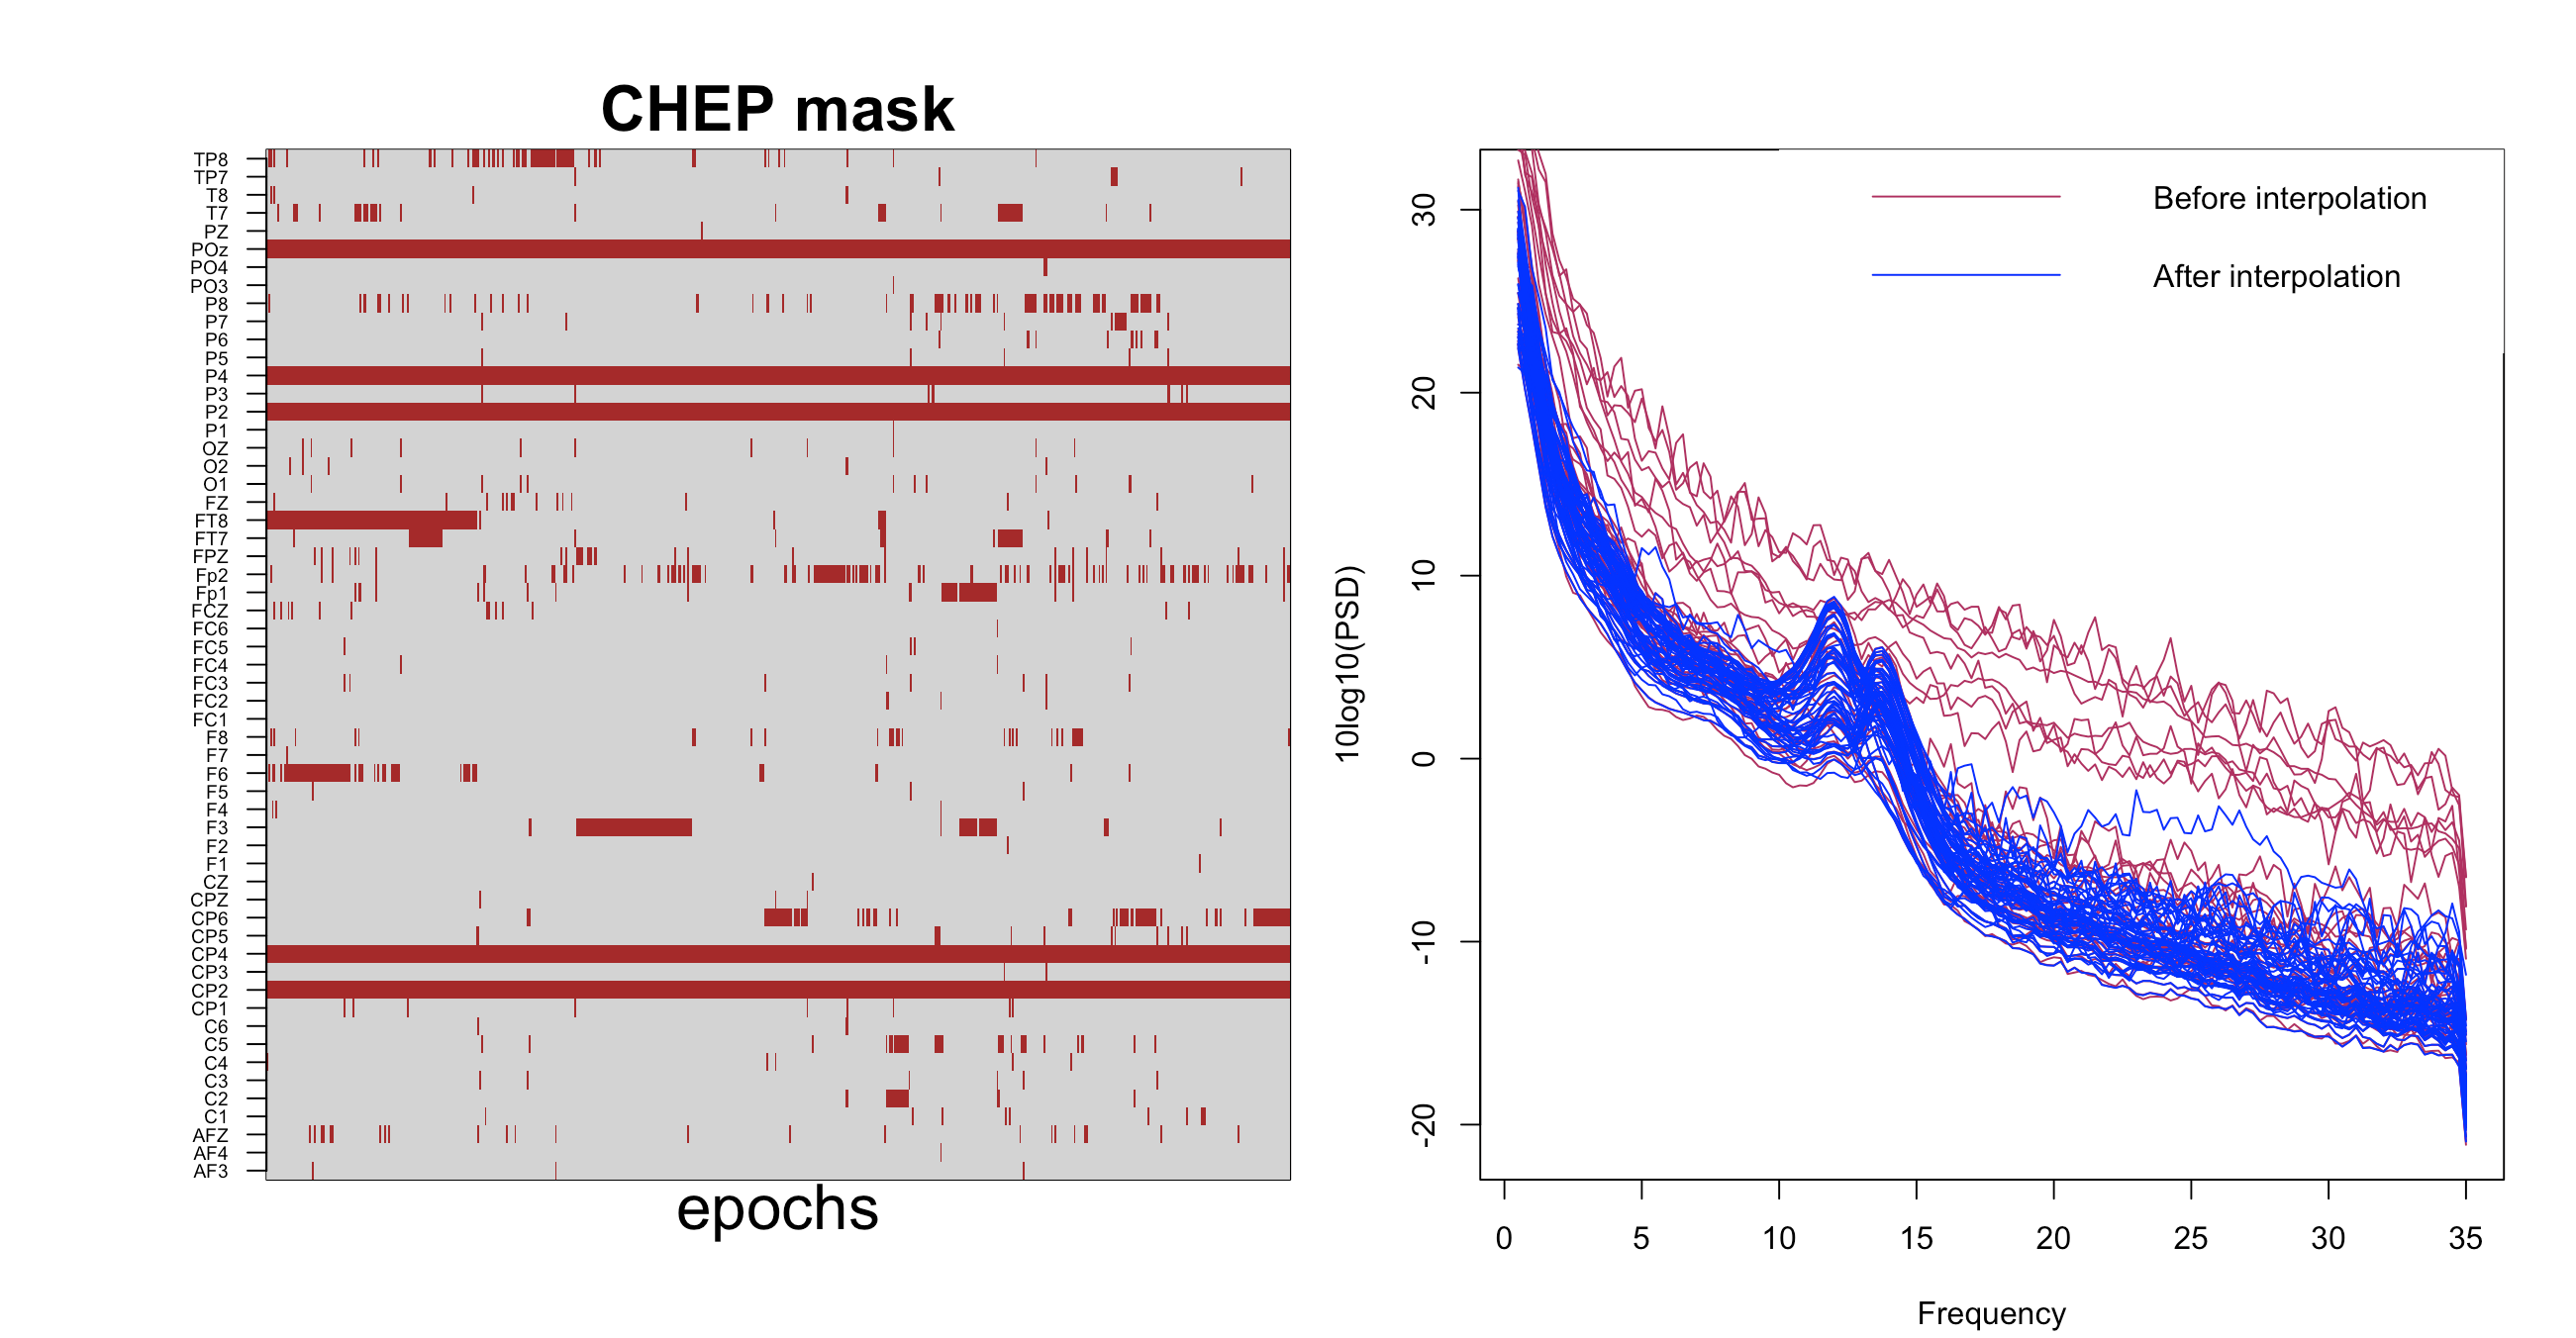
This "patchwork" interpolation scheme results in a PSD plot that looks better (note, only 3% more cheps were interpolated in addition to those arising from the 5 bad channels we defined previously).
Of course, for some analyses, it is important to keep track of which parts of the data were interpolated; this can be achieved by saving the CHEP mask, as plotted on the left-hand side of the figure. This records which epochs and channels were interpolated, as well as the percentage of epochs interpolated per channel, or percentage of channels for which a particular chep was interpolated.
Saving cleaned EDFs
In these examples, we've run
interpolation once but then typically just generated a PSD or
some other statistic. In practice, one would typically want to
save these interpolated EDFs, e.g. using the WRITE command.
Final epoch-level pruning
Finally, we can add an extra round of epoch-level outlier detection,
to remove bad epochs (i.e. which could not be well-interpolated if too
many/all channels were affected by large artifact). We'll repeat the
commands previously run but this time to identify unusual cheps,
using the option ep-th=4,4 (outliers defined with respect to all
other epochs of a channel). We then apply CHEP epochs to mask an
epoch across all channels if it was found to be an outlier in at least
one channel. The CHEP epochs command sets the same epoch-level mask
that Luna uses in other contexts with the MASK
command, e.g. in which epochs are flagged if they
span certain sleep stages, etc (e.g. MASK ifnot=N2). As such, this
channel-agnostic epoch-level mask pairs with the RESTRUCTURE
command, to fully remove from those epochs from the internal
representation of the EDF. That is, think of the CHEP mask and this epoch-level
mask as two intrinsically different entities, but where the latter can be set the former
by using the CHEP epochs command:
luna Subj1.edf -o ss_psd4.db -s ' CHEP-MASK ch-th=2
                                & CHEP channels=0.3
                                & CLOCS file=clocs
                                & INTERPOLATE
                                & CHEP clear
                                & CHEP-MASK ep-th=4,4
                                & CHEP epochs dump
                                & RESTRUCTURE
                                & SIGSTATS epoch
                                & PSD spectrum max=35'
Using TAGs to track output
This time we will dump the CHEP mask only from the second time we run
CHEP command. If one wanted to output the same measures from two or more
runs of the same command, in order to be able to distinguish them in the output,
it would be necessary to add a TAG statement.
Now we can visualize which epochs were removed and how the final data look using this R code:
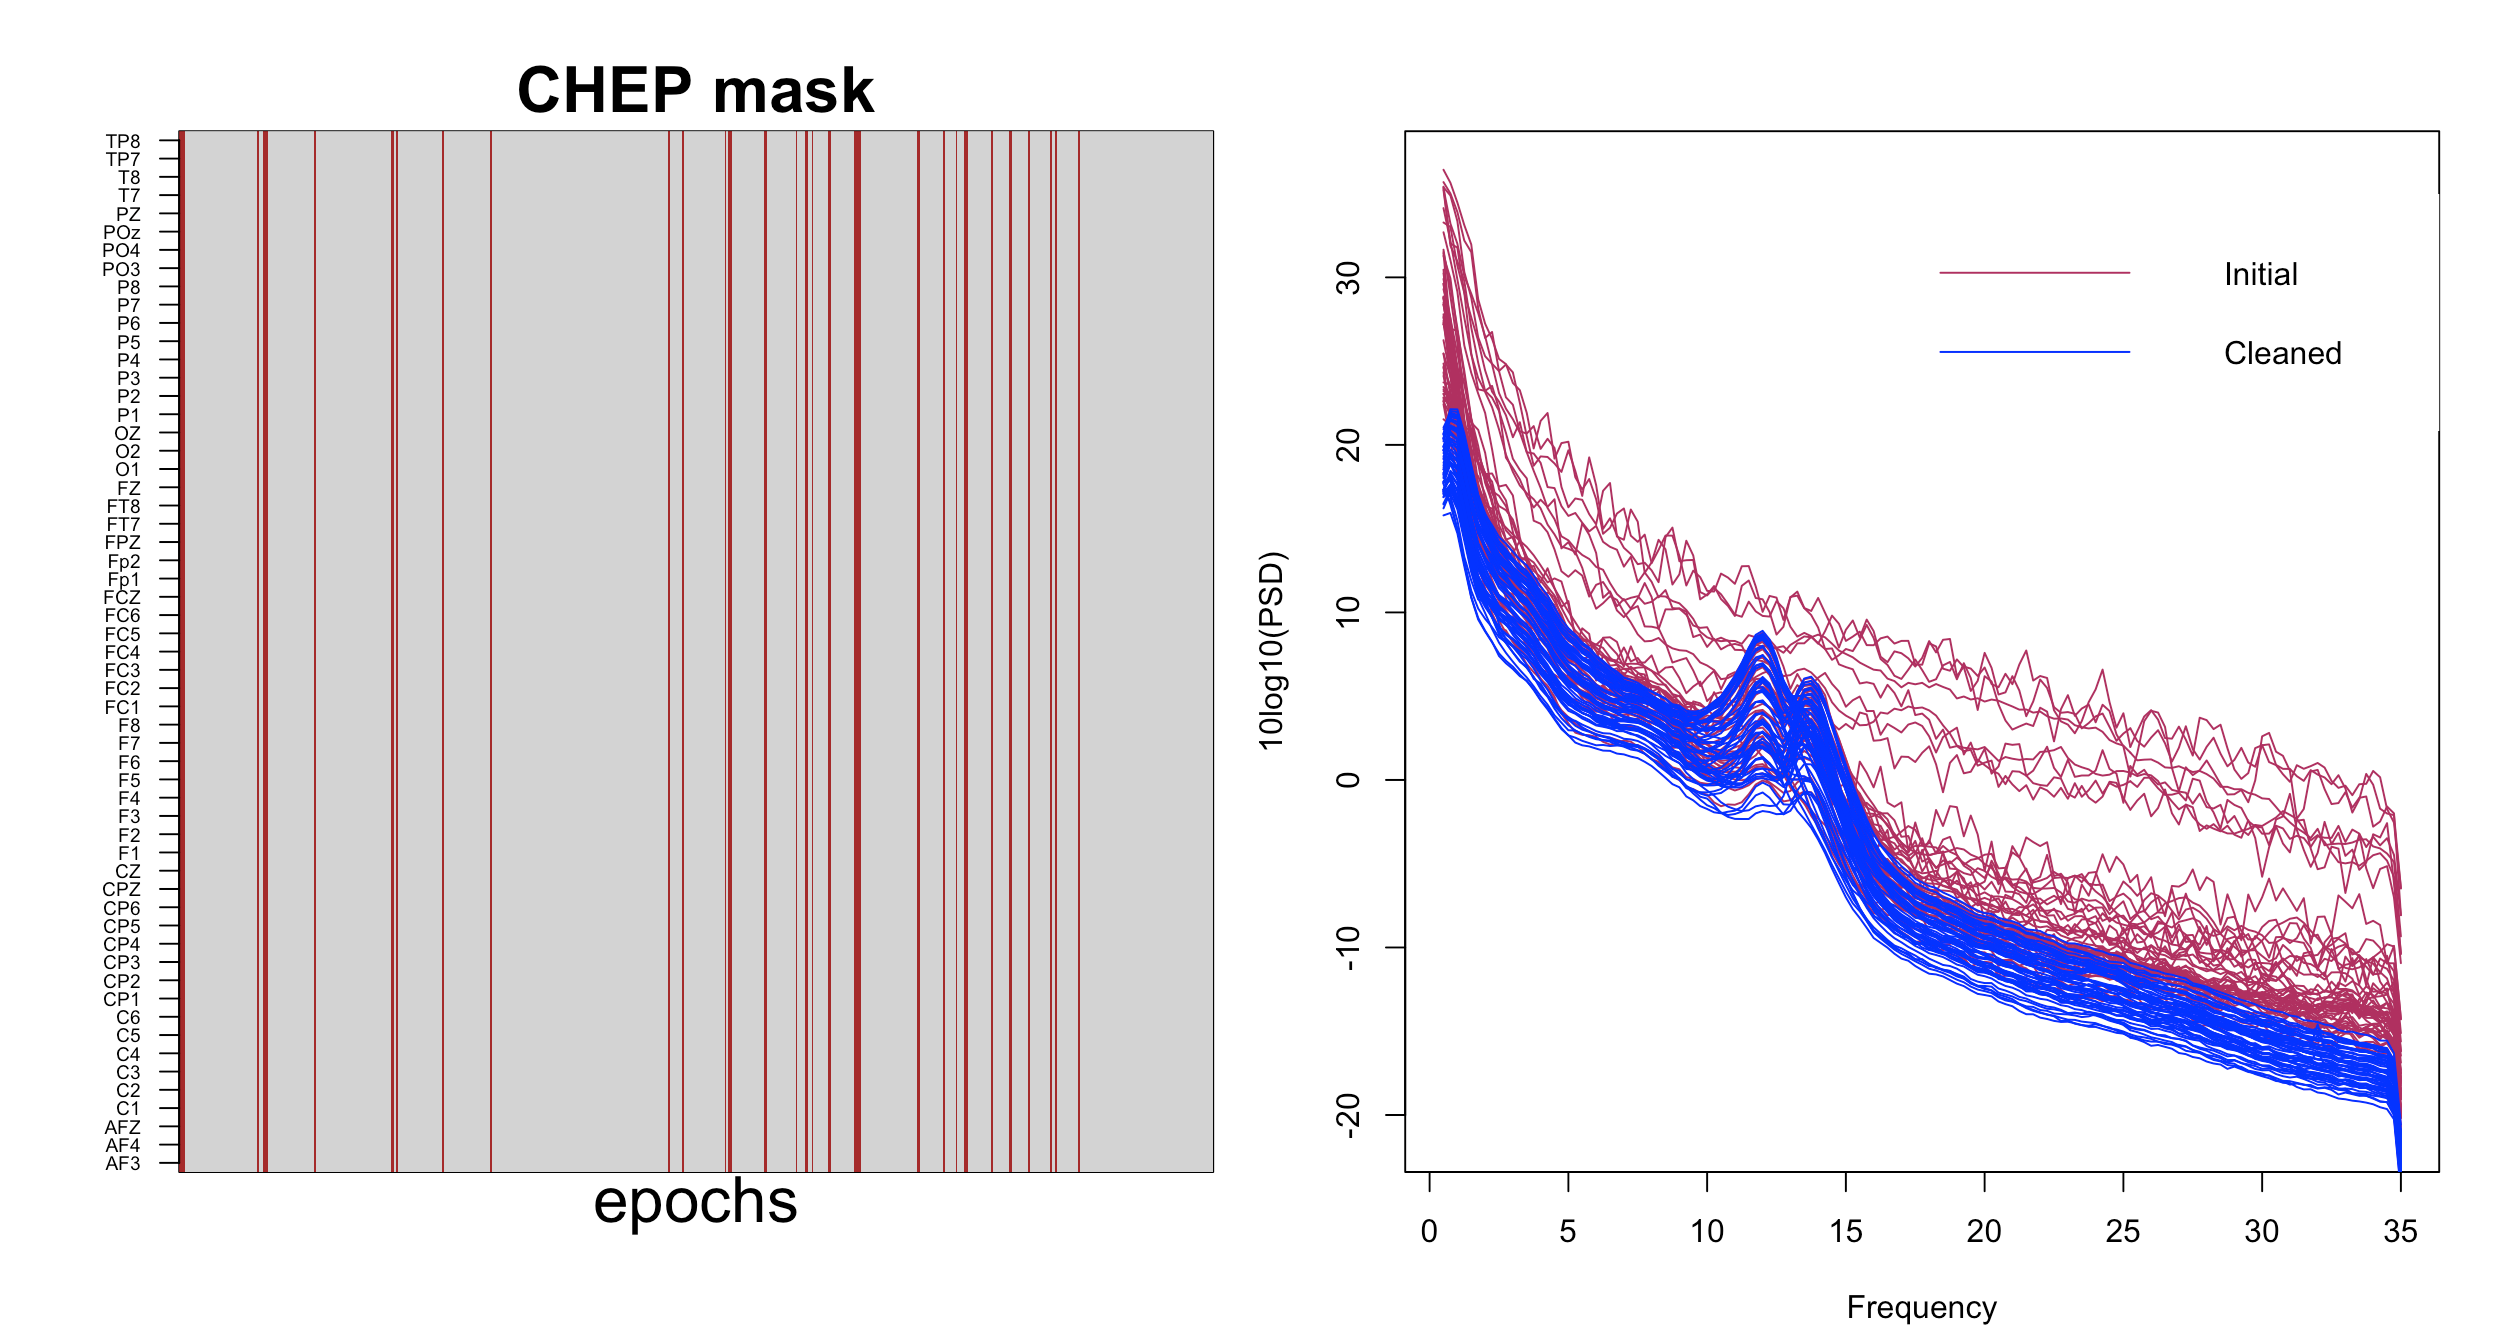
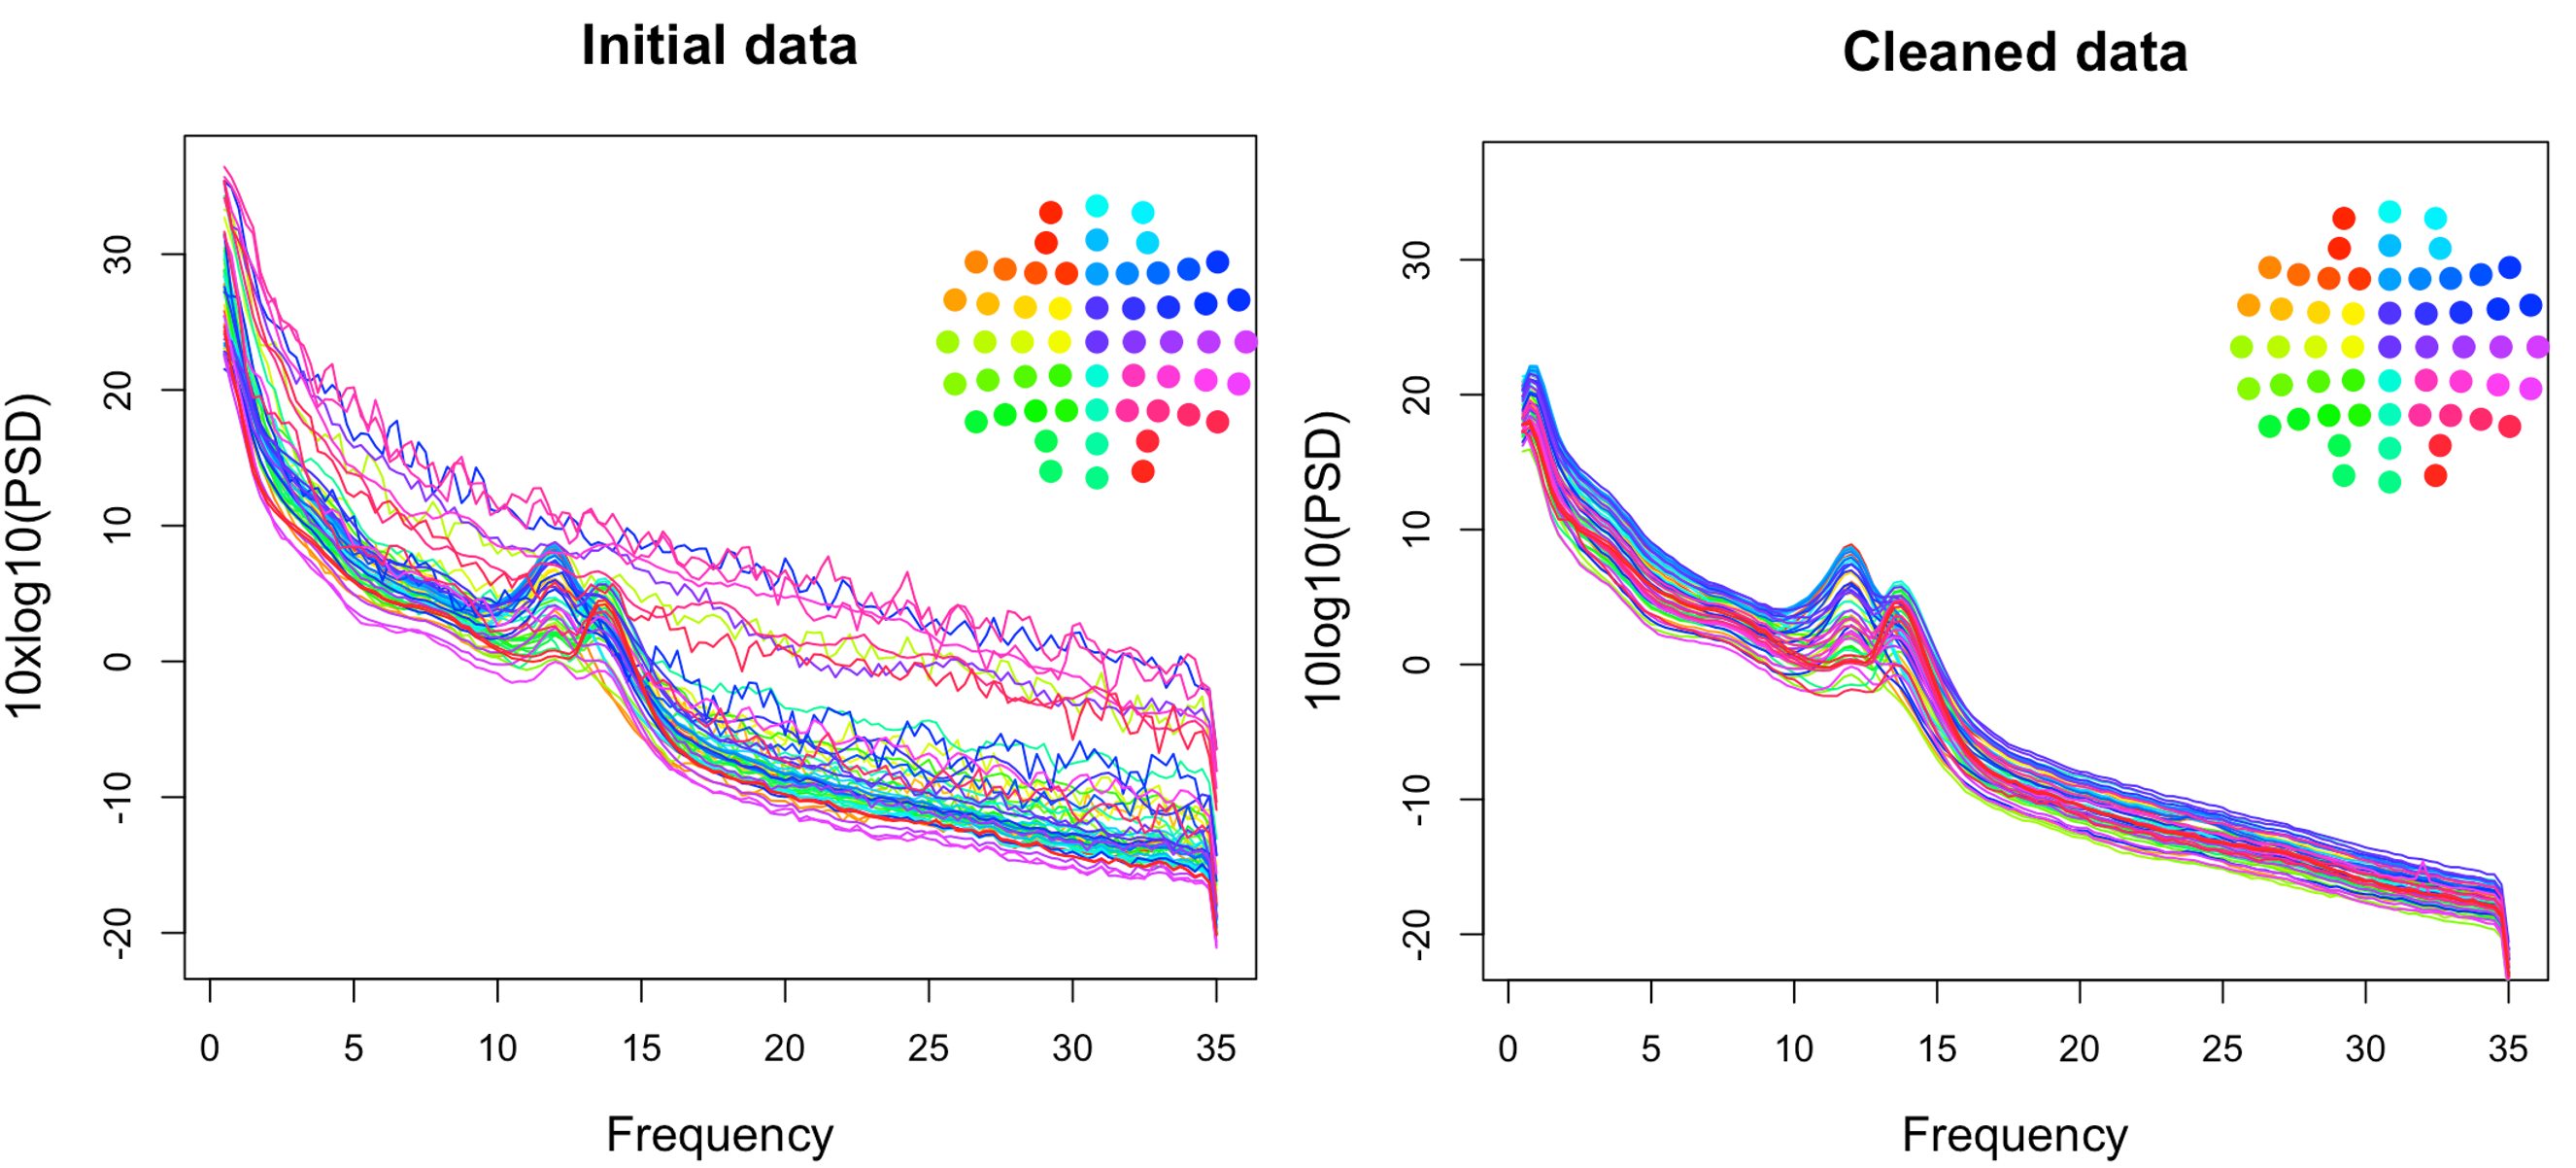
Unlike all previous commands, the above command now results in a slightly shorted recording. Evidently, by removing relatively few epochs (to be exact, 43 epochs, about 7% of our data) we ended up with nice and smooth PSD across all channels. A direct comparison of the initial and cleaned data is below:
Concluding remarks
In this vignette, we used some of Luna's commands for automatic artifact detection and removal. The goal was to develop an understanding of the basic steps and logic behind them
It is important to note that the thresholds, and the order of running
the commands can have a large impact, and different datasets with
different patterns of artifact may have different optimal
strategies. Naturally, there are other diagnostics other than Hjorth
parameters one can imagine using to flag bad epochs (in fact, the
CHEP-MASK commands implements some of these, including diagnostics
for flat signals, clipped signals, or above-threshold amplitudes).
Epoch duration
Another variable in artifact detection is epoch lengh: although this is 30 seconds by default, this can be specified to be any different value; e.g. it might make sense to clean data using a smaller 5-second window which would improve both the sensitivity to detect shorter artifacts, and decrease the amount of bad data that needs to be discarded/interpolated. This is achieved by adding this command to the start of the above scripts:
EPOCH dur=5
It is also important to remember that some downstream analyses will be more sensitive to bad data than others; also, some analyses may require that more of the original data be preserved (e.g. if looking at ultradian dynamics, it will not be sufficient to extract only 30 minutes of data, no matter how prestine it is). In other words, there is not necessarily a one-size-fits-all approach that we can suggest. Using the scripting approaches above, it is obviously possible to tweak a number of these features, however, that when combined with appropriate visualization, can be used to build an artifact detection pipeline that is hopefully more suitable for a given dataset.
In future vignettes we'll consider other sources of artifact (e.g. ocular and cardiac physiological artifacts) as well as alternative or complementary approaches to detecting and correcting them as implemented in Luna (e.g. ICA).