Outputs
Commands to rewrite EDFs and signals/annotations in other text-based formats
| Command | Description |
|---|---|
WRITE |
Write a new EDF file |
MATRIX |
Dump signals (and annotations) to a file |
HEAD |
Show a small interval of signal data |
DUMP-RECORDS |
Dump annotations and signals, by EDF record |
RECS |
Dump basic information on EDF record structure |
SEGMENTS |
Dump (discontinuous EDF+) intervals |
SEDF |
Generate a "summary EDF" |
WRITE
Save a (modified) EDF file to disk
Writes a new EDF to disk, that will reflect any manipulation, filtering, or masking, etc, that has been applied.
Parameters
| Parameter | Example | Description |
|---|---|---|
sig |
sig=C3 |
Signal to output (only one) |
edf-dir |
edf-dir=edfs/ |
Set folder where new EDFs should be written |
edf-tag |
edf-tag=v2 |
Add a tag to each new EDF filename |
edf |
edf=f1 |
Write to edf f1.edf |
sample-list |
sample-list=v2.lst |
Name of the new sample-list |
Output
No formal output, other than a message to the log and one or more new EDFs.
Example
To write a set of new EDFs that (for example) have been masked,
filtered and retaining only one signal, given the commands in a file,
say cmd.txt as follows:
EPOCH                       % Epoch the signals

MASK epoch=1-10             % Set to retain only the first 10 epochs

RESTRUCTURE                 % Apply the above mask

SIGNALS keep=EEG            % Only retain the EEG signal

FILTER bandpass=0.5,4.5     % Apply a bandpass filter to the signal
       ripple=0.01
       tw=0.5

WRITE edf-dir=newx/         % Write new EDFs, to the folder newx/
      edf-tag=v2            % add a 'v2' tag to each EDF
      sample-list=newx.lst  % create a new sample list pointing to the new EDFs
Running this set of commands:
luna s.lst < cmd.txt
will produce a new folder newx with three new EDFs:
ls newx
learn-nsrr01-v2.edf learn-nsrr02-v2.edf learn-nsrr03-v2.edf
That is, the new EDF filenames have a -v2 tag added. The folder
(which must be specified with a / character in the edf-dir
argument) will be created if it does not exist. In addition, Luna
creates a new sample-list called
newx.lst, that points to these new EDFs:
cat newx.lst
nsrr01        newx/learn-nsrr01-v2.edf
nsrr02        newx/learn-nsrr02-v2.edf
nsrr03        newx/learn-nsrr03-v2.edf
Note that Luna appends each item to this list, and so you may want to delete it before running the command, if it already exists.
We can use the new sample list to check the properties of the new set of EDFs:
luna newx.lst -s DESC
As expected, we do in fact see that the EDFs are now only 10 epochs in length and contain only a single channel: (here, showing output only for the first EDF):
EDF filename      : newx/learn-nsrr01-v2.edf
ID                : nsrr01
Clock time        : 21:58:17 - 22:03:17
Duration          : 00:05:00
# signals         : 1
# EDF annotations : 1
Signals           : EEG[125]
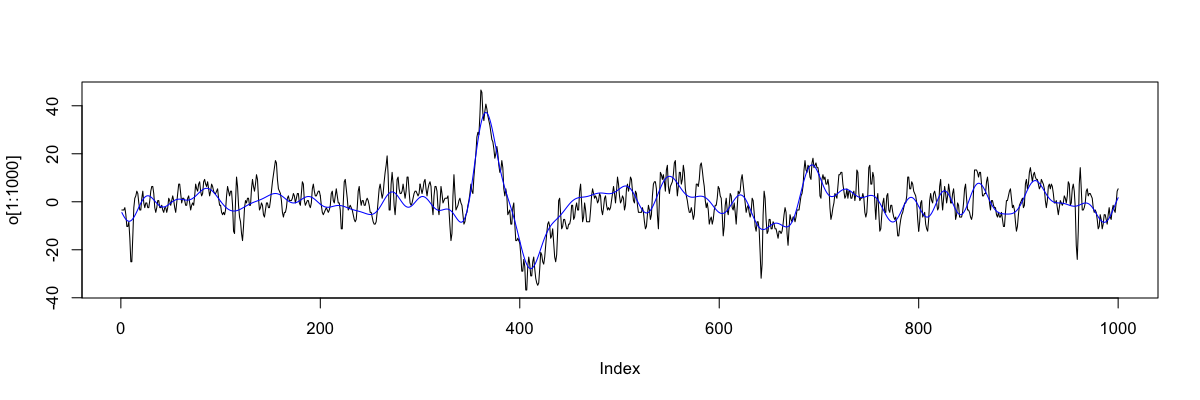
Finally, to check the filtering, we can use the MATRIX command to
dump the raw signals to a file. First from the original EDF (for the first 10 epochs only):
luna s.lst 1 -s "MASK epoch=1-10 & RE & MATRIX sig=EEG file=old.txt"
luna newx.lst 1 -s "MATRIX file=new.txt"
In R
o <- scan("old.txt",skip=1)
n <- scan("new.txt",skip=1)
plot( o[1:1000] , type="l" )
lines( n[1:1000] , col="blue" )
MATRIX
Dumps signal information to a file
For one or more signals of similar sampling rates, this command generates a text file containing the raw signal data.
Parameters
| Parameter | Example | Description |
|---|---|---|
file |
file=signals.txt |
Required parameter, to specify the filename for the output |
sig |
sig=C3,C4 |
Restrict output to these signals/channels |
hms |
hms |
Add a clock-time column in hh:mm:ss format |
hms2 |
hms2 |
Add a clock-time column in hh:mm:ss:microsecond format |
annot |
annot=X,Y |
Add columns with values 1/0 to indicate the presence/absence of that annotation |
min |
min |
Minimal output to show only signal information (no headers or lead columns) |
Output
All output is written to a text file as specified by the file parameter. For example:
ID    E   S   SP   T           EOG-L      EOG-R     EMG       EEG
id01  1   0   0    0           -6.07448   4.18193   31.044    0.763126
id01  1   0   1    0.00390625  -0.030525  2.83883   52.7778   11.5079
id01  1   0   2    0.0078125   7.23443    2.22833   45.3297   23.0464
id01  1   0   3    0.0117188   11.569     2.10623   23.4127   29.4567
id01  1   0   4    0.015625    12.9731    2.16728   8.82173   31.2882
id01  1   0   5    0.0195312   12.79      2.22833   -4.73138  30.7387
id01  1   0   6    0.0234375   12.1795    2.28938   -13.6447  29.6398
id01  1   0   7    0.0273438   11.6911    2.22833   -14.1331  28.663
id01  1   0   8    0.03125     11.3858    2.22833   -11.8742  28.0525
id01  1   0   9    0.0351562   11.2027    2.16728   -13.4615  27.6862
... cont'd ...
Here, the first five columns are:
ID: individual/EDF IDE: epoch numberS: elapsed time in seconds (integer)SP: sample point in the EDF recordT: elapsed time in seconds
The subsequent columns represent the channels in the EDF (or those
specified by the sig parameter).
If the min (or minimal) parameter is specified, then the header
and the first five columns are omitted.
If the hms parameter is specified, then an additional column HMS
is added, which is the clock-time in hh:mm:ss format. If hms2 is
specified instead of hms, this field is printed with micro-second
resolution.
If the annot parameter is specified, additional columns are added
with the same names as the annotations specified, e.g. annot=X,Y
will add two columns X and Y. For each sample point, these
columns will have a 0 or 1 value to indicate whether or not that
annotation was present at that point.
HEAD
Writes a small amount of signal data to standard output
This command is useful to sanity-check signals and epochs, by outputting just a small amount of data (e.g. a few seconds worth) for one or more channels, for a given epoch.
If multiple channels are output, they must all have the same sample rate.
Parameters
| Parameter | Example | Description |
|---|---|---|
sig |
C3,C4 |
Show these channels (default: all channels) |
epoch |
100 |
Show epoch 100 (default: first epoch) |
sec |
0.5 |
Only show a fixed duration (secs) of the epoch (default: whole epoch) |
Output
All output is sent to the console (stdout) and so can be redirected,
etc. Output is tab-delimited; the first three columns are T
(elapsed seconds from start of EDF), SEC (elapsed seconds in this
segment of data) and SP (sample point in this segment of data,
starting at 0). The subsequent columns are for the requested channels.
Example
To output 0.05 second's worth of data for two EOG channels, from a particular epoch of an EDF (here, 222):
luna s.lst 1 -s HEAD epoch=222 sig=EOG_L,EOG_R sec=0.05 > o.txt
T          SEC         SP      EOG_L       EOG_R
6630       0           0    -8.21123    -6.37973
6630       0.00390625  1    -7.72283    -5.52503
6630.01    0.0078125   2    -6.68498    -4.30403
6630.01    0.0117188   3    -5.76923    -3.20513
6630.02    0.015625    4    -4.91453    -2.71673
6630.02    0.0195312   5    -3.26618    -2.47253
6630.02    0.0234375   6   -0.457875    -1.98413
6630.03    0.0273438   7     2.28938    -1.31258
6630.03    0.03125     8     3.93773   -0.763126
6630.04    0.0351562   9     4.30403  -0.0915751
6630.04    0.0390625   10    4.18193    0.763126
6630.04    0.0429688   11    3.99878     1.43468
6630.05    0.046875    12    3.87668     1.67888
Note
Note that T may have limited numerical precision in the output.
This command is intended for quick reviews of signals (i.e. to see
units, scales, etc).
DUMP-RECORDS
Writes detailed annotation and signal data to standard output
This command is unlikely to be of great utility to most users. It
dumps detailed information about the signals and annotations to
stdout.
Parameters
| Parameter | Description |
|---|---|
no-signals |
Do not show signal data |
no-annots |
Do not show annotation information |
Output
All output is sent to the console (stdout) and so can be redirected,
etc. Output is organized by EDF record, e.g.:
Record 1 of 40920 total (30 retained)
Generic Annotations-----------------------
wake    wake    0.00->30.00     wake[flag]=.
EDF Annotations--------------------------
Signal 15 EDF Annotations
<0||(time-stamp, secs)>
SaO2 has a sample rate of 1 Hz, and so there is only one entry per record:
s = 0
interval = 0-999999999999
RECORD-DUMP     SaO2    rec=0   1/1     0       0       95.115587
PR:
s = 1
interval = 0-999999999999
RECORD-DUMP     PR      rec=0   1/1     0       0       74.222934
s=2) is EEG(sec), which has a sample rate of 125Hz (and so 125 entries here):
s = 2
interval = 0-999999999999
RECORD-DUMP     EEG(sec)        rec=0   1/125   0       0       -0.49019608
RECORD-DUMP     EEG(sec)        rec=0   2/125   8000000000      0.008   1.4705882
RECORD-DUMP     EEG(sec)        rec=0   3/125   16000000000     0.016   6.372549
RECORD-DUMP     EEG(sec)        rec=0   4/125   24000000000     0.024   3.4313725
RECORD-DUMP     EEG(sec)        rec=0   5/125   32000000000     0.032   -10.294118
RECORD-DUMP     EEG(sec)        rec=0   6/125   40000000000     0.04    -8.3333333
RECORD-DUMP     EEG(sec)        rec=0   7/125   48000000000     0.048   1.4705882
RECORD-DUMP     EEG(sec)        rec=0   8/125   56000000000     0.056   -0.49019608
RECORD-DUMP     EEG(sec)        rec=0   9/125   64000000000     0.064   -0.49019608
RECORD-DUMP     EEG(sec)        rec=0   10/125  72000000000     0.072   7.3529412
RECORD-DUMP     EEG(sec)        rec=0   11/125  80000000000     0.08    11.27451
... cont'd ...
- a standard
RECORD-DUMP - signal name
- record number (starting at 0)
- the sample point per record (e.g.
1/125,2/125, etc) - the starting time for that sample point in time units
- time in seconds
- the value of the signal
For most purposes, the MATRIX command will likely be an
easier route to achieve direct access to the signals in an EDF. (In
fact, this command was in large part only added to assist in debugging
during Luna development, but is described here for completeness.)
RECS
Dumps basic information about record structure to standard output
Parameters
None.
Output
Text written to the log/console; this command does not generate any output through Luna's standard output mechanism.
Example
Taking the first tutorial EDF (where EDF is one second):
luna s.lst 1 -s SUMMARY
Rec. dur. (s) : 1
we extract a subset of the data (epochs 5 through 8, defaulting to 30-second epochs) and then call the RECS command:
luna s.lst 1 -s 'MASK epoch=5-8 & RECS'
The output (to the console) is as follows (abridged):
RECS    nsrr01  1   121 120/40920   120.00->121.00   5;120.00->150.00
RECS    nsrr01  2   122 120/40920   121.00->122.00   5;120.00->150.00
RECS    nsrr01  3   123 120/40920   122.00->123.00   5;120.00->150.00
RECS    nsrr01  4   124 120/40920   123.00->124.00   5;120.00->150.00
RECS    nsrr01  5   125 120/40920   124.00->125.00   5;120.00->150.00

...

RECS    nsrr01  115 235 120/40920   234.00->235.00   8;210.00->240.00
RECS    nsrr01  116 236 120/40920   235.00->236.00   8;210.00->240.00
RECS    nsrr01  117 237 120/40920   236.00->237.00   8;210.00->240.00
RECS    nsrr01  118 238 120/40920   237.00->238.00   8;210.00->240.00
RECS    nsrr01  119 239 120/40920   238.00->239.00   8;210.00->240.00
RECS    nsrr01  120 240 120/40920   239.00->240.00   8;210.00->240.00
The columns are:
RECScommand label- current EDF ID
- record number with respect to current in-memory EDF representation (always starts 1)
- record number with respect to original EDF file (starting 121, i.e. the start of the fifth epoch)
- number of records in the current in-memory EDF / total number of records in the on-file EDF
- start and stop of this record (in seconds)
- (for epoched data) the epoch number (e.g. 5-8) that record belongs to, and the epoch start/stop (seconds)
Four 30-second epochs (5,6,7 and 8) implies 120 seconds; the start/stop times correspond to this, as expected: 240-121+1 = 120.
SEGMENTS
Reports the number of contiguous segments in an EDF/EDF+
Identifies and reports on the contiguous segments in a file; this is
primarily of use for EDF+ files with discontinuous signal data.
Internally, Luna represents signal data as equivalent to an EDF+ after
any masks that remove epochs have been applied;
therefore, the SEGMENTS command can also be used in this
context too.
Parameters
| Parameter | Description |
|---|---|
annot |
Add annotations to mark segment/gap boundaries |
Output
Basic EDF header information (strata: none)
| Variable | Description |
|---|---|
NR |
Number of segments |
Per-segment information (strata: SEG)
| Variable | Description |
|---|---|
START |
Segment start (seconds) |
STOP |
Segment stop (seconds) |
START_HMS |
Segment start (hh:mm:ss) |
STOP_HMS |
Segment stop (hh:mm:ss) |
DUR_HR |
Segment duration (hours) |
DUR_MIN |
Segment duration (minutes) |
DUR_SEC |
Segment duration (seconds) |
Example
Taking the first tutorial EDF, which is a continuous EDF file:
luna s.lst 1 -s SEGMENTS
We'd expect just a single segement to be reported, and this is indeed what we see:
destrat out.db +SEGMENTS
ID  NSEGS
nsrr01  1
destrat out.db +SEGMENTS -r SEG
ID      SEG  DUR_HR   DUR_MIN  DUR_SEC  START  START_HMS  STOP   STOP_HMS
nsrr01  1    11.3667  682      40920     0     21.58.17   40920  09.20.17
In contrast, if we break up the data (e.g. using the
MASK command, then the data are implicitly
represnted as a discontinuous EDF+ after restructuring:
luna s.lst 1 -t out -s 'MASK epoch=9-12,22-23,70-74 & RE & SEGMENTS'
Hint
Note, purely to illustrate different options, here we used Luna's -t output option rather than -o
Now the SEGMENT command shows the expected three segments:
cat out/nsrr01/SEGMENTS.txt
ID  NSEGS
nsrr01  3
cat out/nsrr01/SEGMENTS-SEG.txt
ID     SEG  DUR_HR     DUR_MIN  DUR_SEC  START  START_HMS  STOP  STOP_HMS
nsrr01 1    0.0333333  2        120      240    22.02.17   360   22.04.17
nsrr01 2    0.0166667  1        60       630    22.08.47   690   22.09.47
nsrr01 3    0.0416667  2.5      150      2070   22.32.47   2220  22.35.17
If annotations are added, the default labels are segment and gap (with the instance ID
reflecting the number of each). These labels can be changed with the special variables annot-segment and annot-gap (i.e.
if there is a pre-existing annotation with that label:
luna s.lst annot-gap=G -s 'SEGMENTS annot & WRITE-ANNOTS file=^.annot'
See this vignette for an example of using SEGMENTS annot to track changes from an EDF+D to an EDF file.
SEDF
Generates a summary-EDF and writes it to disk
For data channels only (i.e. not any EDF+ annotation channels), the SEDF command
creates a "summary" EDF
| Option | Description |
|---|---|
sig |
Signals to output (if not given, all signals) |
sedf-dir |
Directory for SEDFs (if not working directory) |
This creates an EDF in which contains epoch-level summary statistics of the original EDF. That is, if the original EDF has 1000 30-second epochs, the SEDF will comprise only 1000 records, where each record has a duration of 30 seconds, and contains only a single value. For a given channel, e.g. CZ, the SEDF will contain three new channels, depending on the type of that channel. For a channel called XYZ in the original:
- for oscillatory signals (e.g. EEG, EMG, etc), the three Hjorth parameters:
XYZ_H1,XYZ_H2andXYZ_H3 - for other signals (e.g. light or heart rate, etc), the mean, min and max:
XYZ_M,XYZ_L,XYZ_U
The idea is that this SEDF file is an effective thumbnail for the EDF, which can be quickly loaded and rendered, e.g. by a viewer application.