Hypnoscope
Overview
Hypnoscope is a simple utility for viewing one or many hypnograms, available either online (https://remnrem.net/) for local download. It operates in two modes:
-
N=1 : given sleep stages for one individual, generate a hypnogram image and various summary statistics
-
N>1 : given many hypnograms (hundreds or thousands), align, sort and filter a condensed visual summary of these hypnograms
Uses of N>1 hypnoscope viewing
The N>1 mode can be useful for exposing various properties of the staging and timing of studies in a whole cohort: for example, if all recordings are truncated at a particular clock time. See this vignette for motivations and examples, as well as the gallery below.
Basic usage
See the Inputs section below for a description of required input formats and notes on how Luna can generate them.
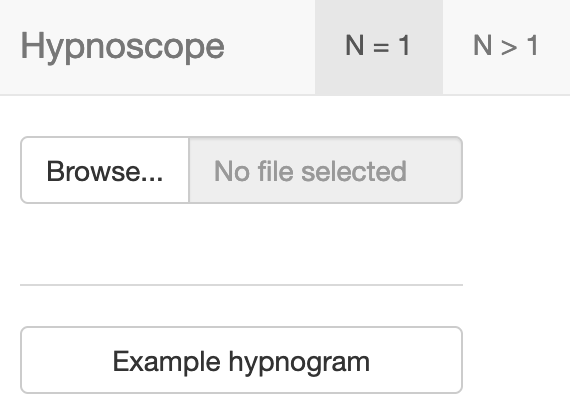
N=1 mode
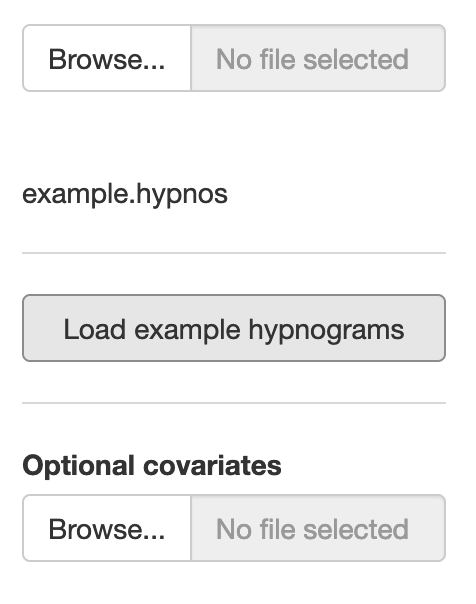
You can upload a staging annotation file that follows sleep stage conventions as described here. Alternatively, click Example hypnogram to load single example dataset.
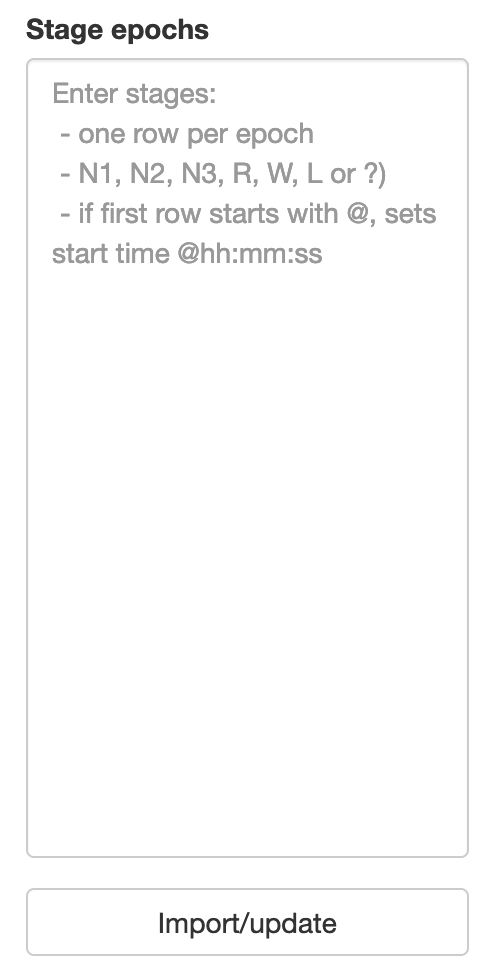
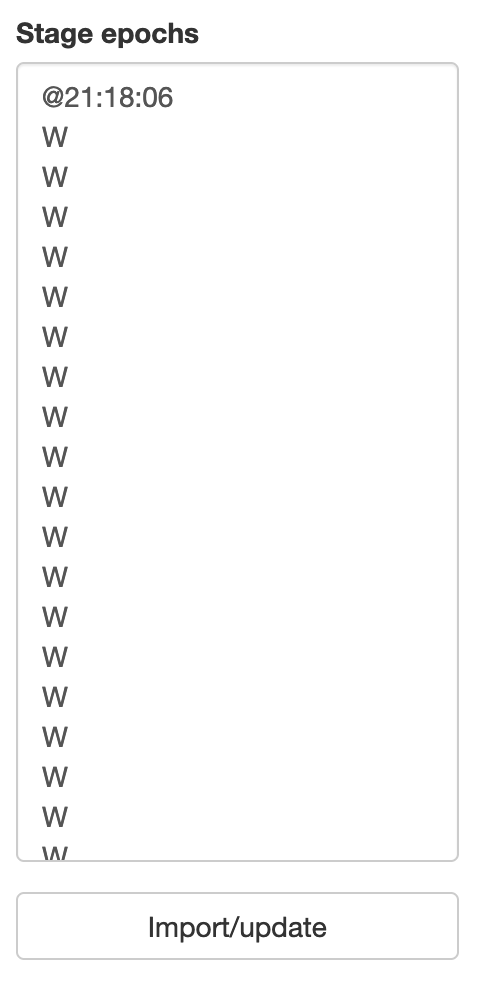
Alternatively, you can cut-and-paste whitespace-delimited plaintext
into the Stage epochs window, and then click Import/update below.
This assumes the following stage labels: W, N1, N2, N3, R,
? and L (for lights on epochs). Optionally, you can specify the
start time (i.e clock-time for when the first epoch is, in 24-hour
format prepending a @ character: e.g. @22:30:00).
After loading a valid hypnogram via either means, you should see something like the following:
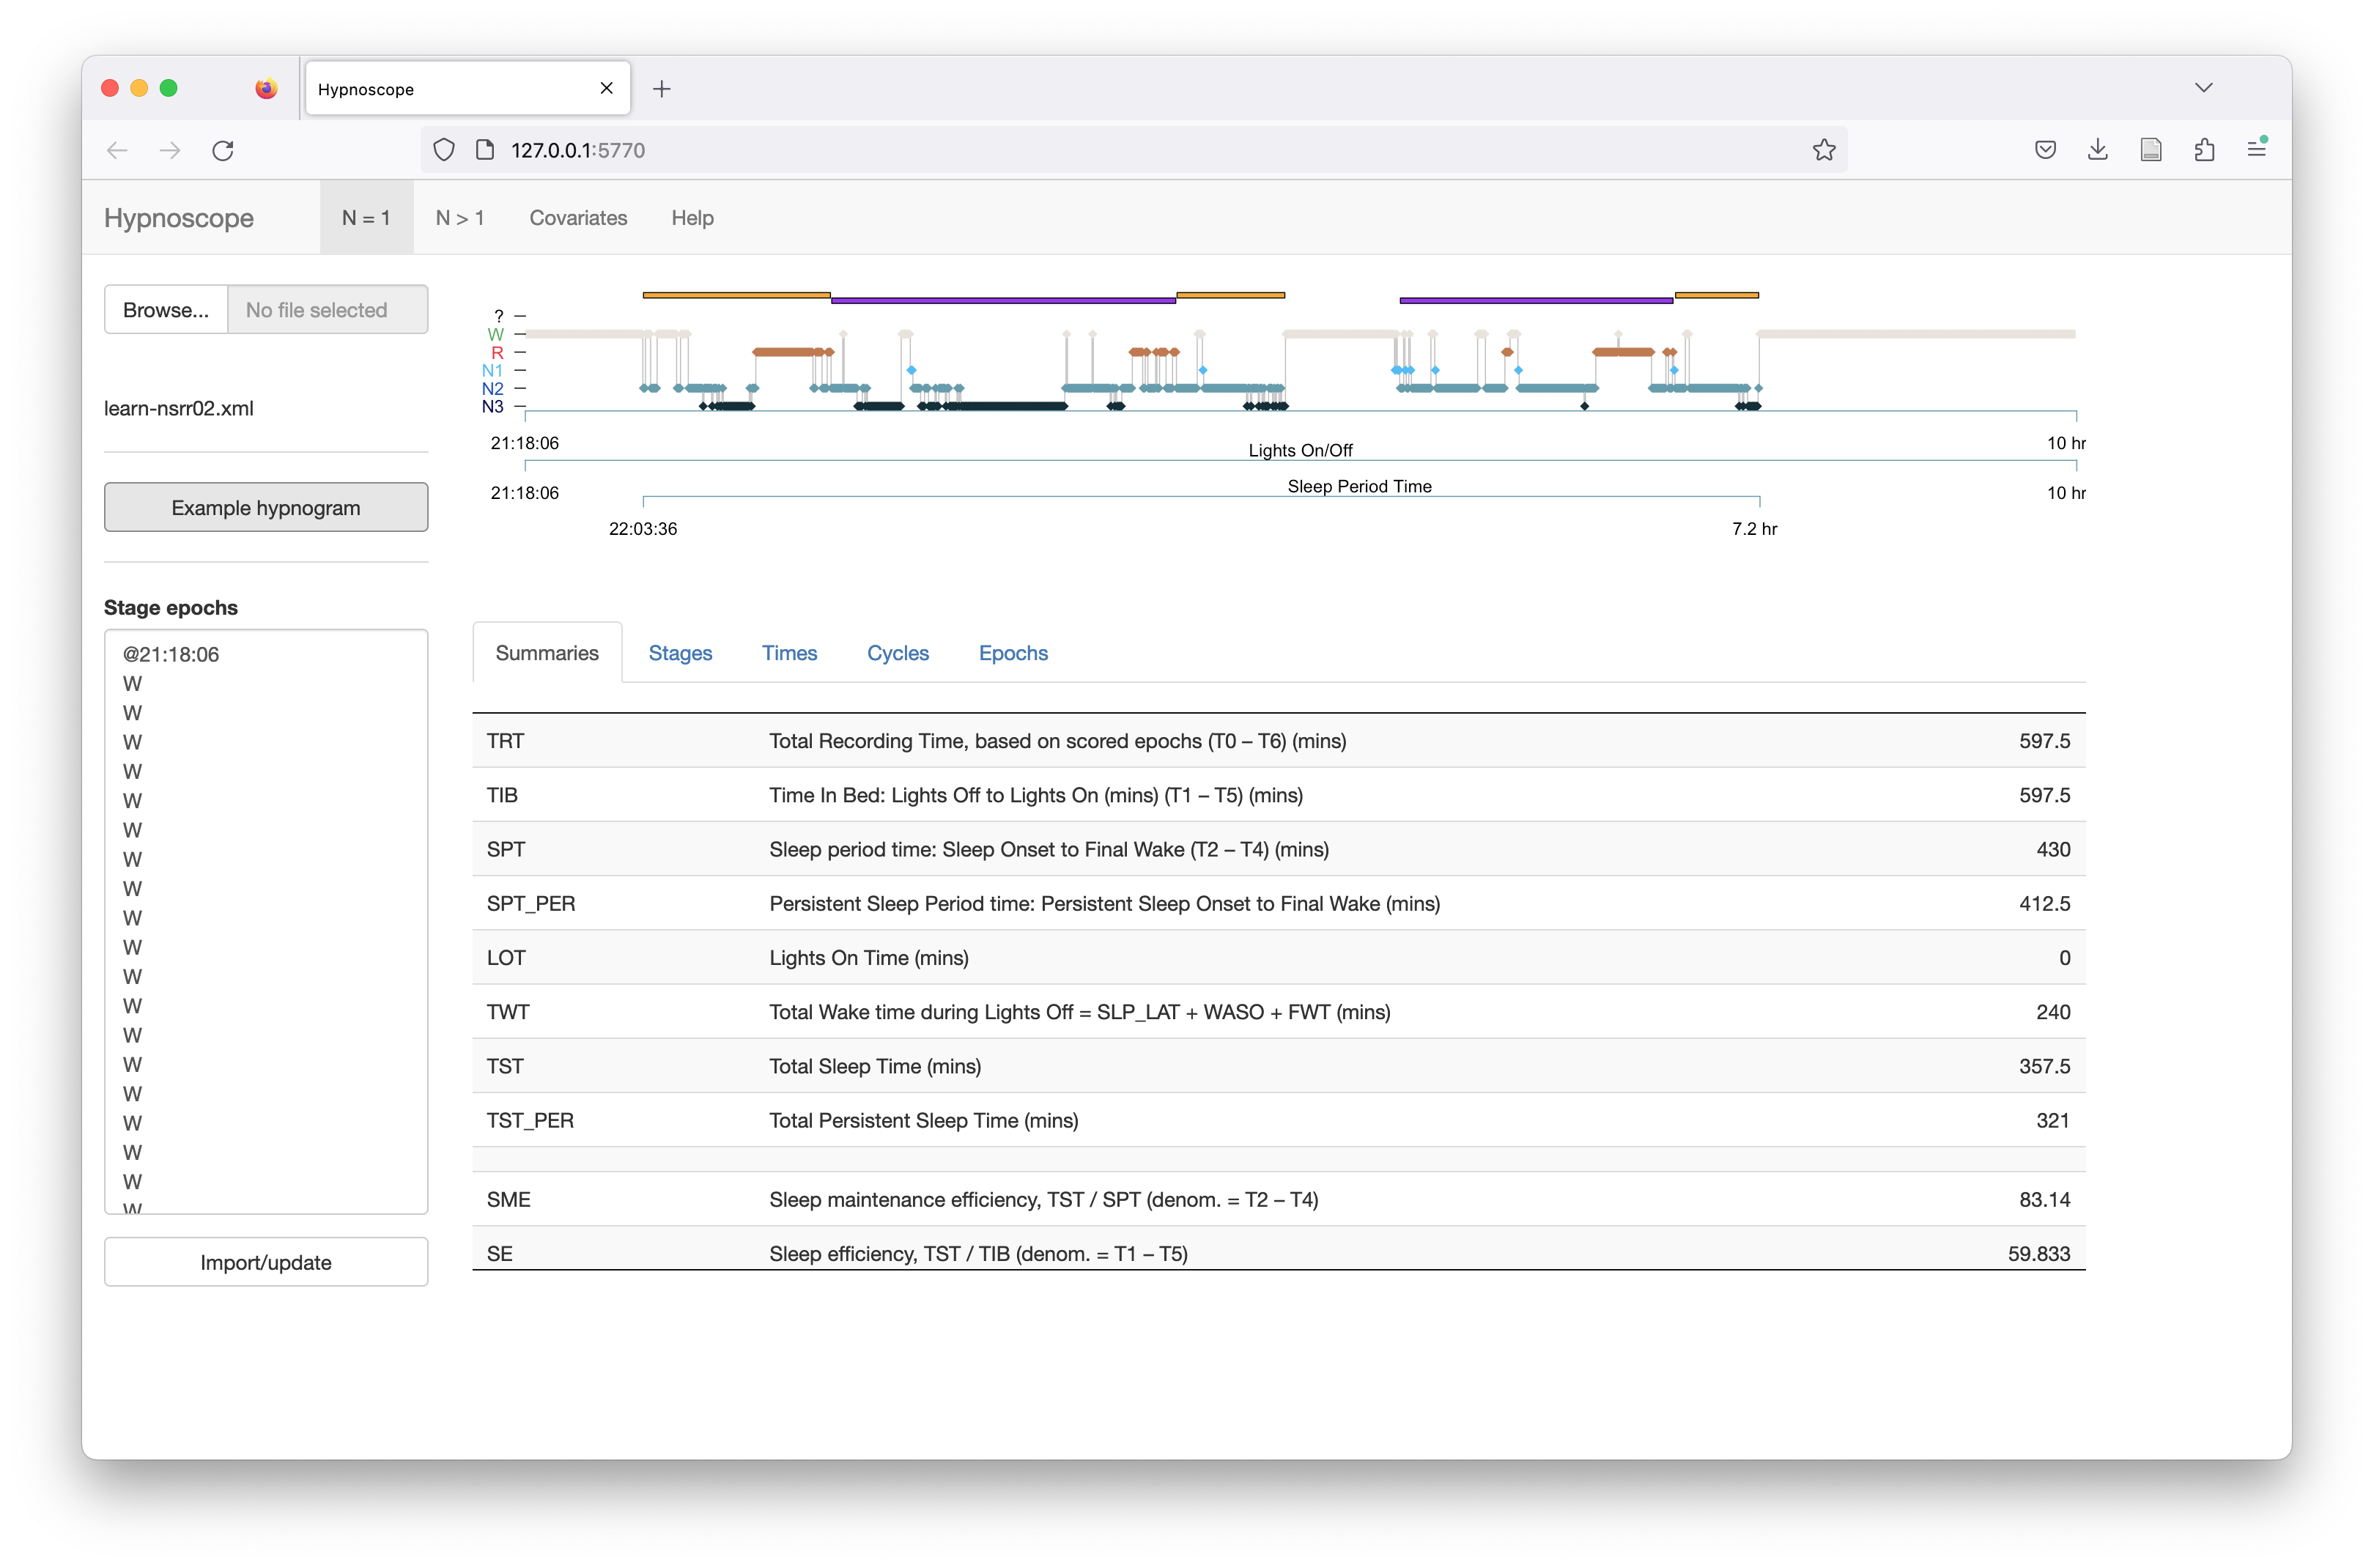
After uploading the data, the Stage epochs box will be populated with the extracted stages. You can make edits here and click Import/update to recalculate statistics:
The metrics and summaries are described on this Luna and Moonlight pages.
N>1 mode
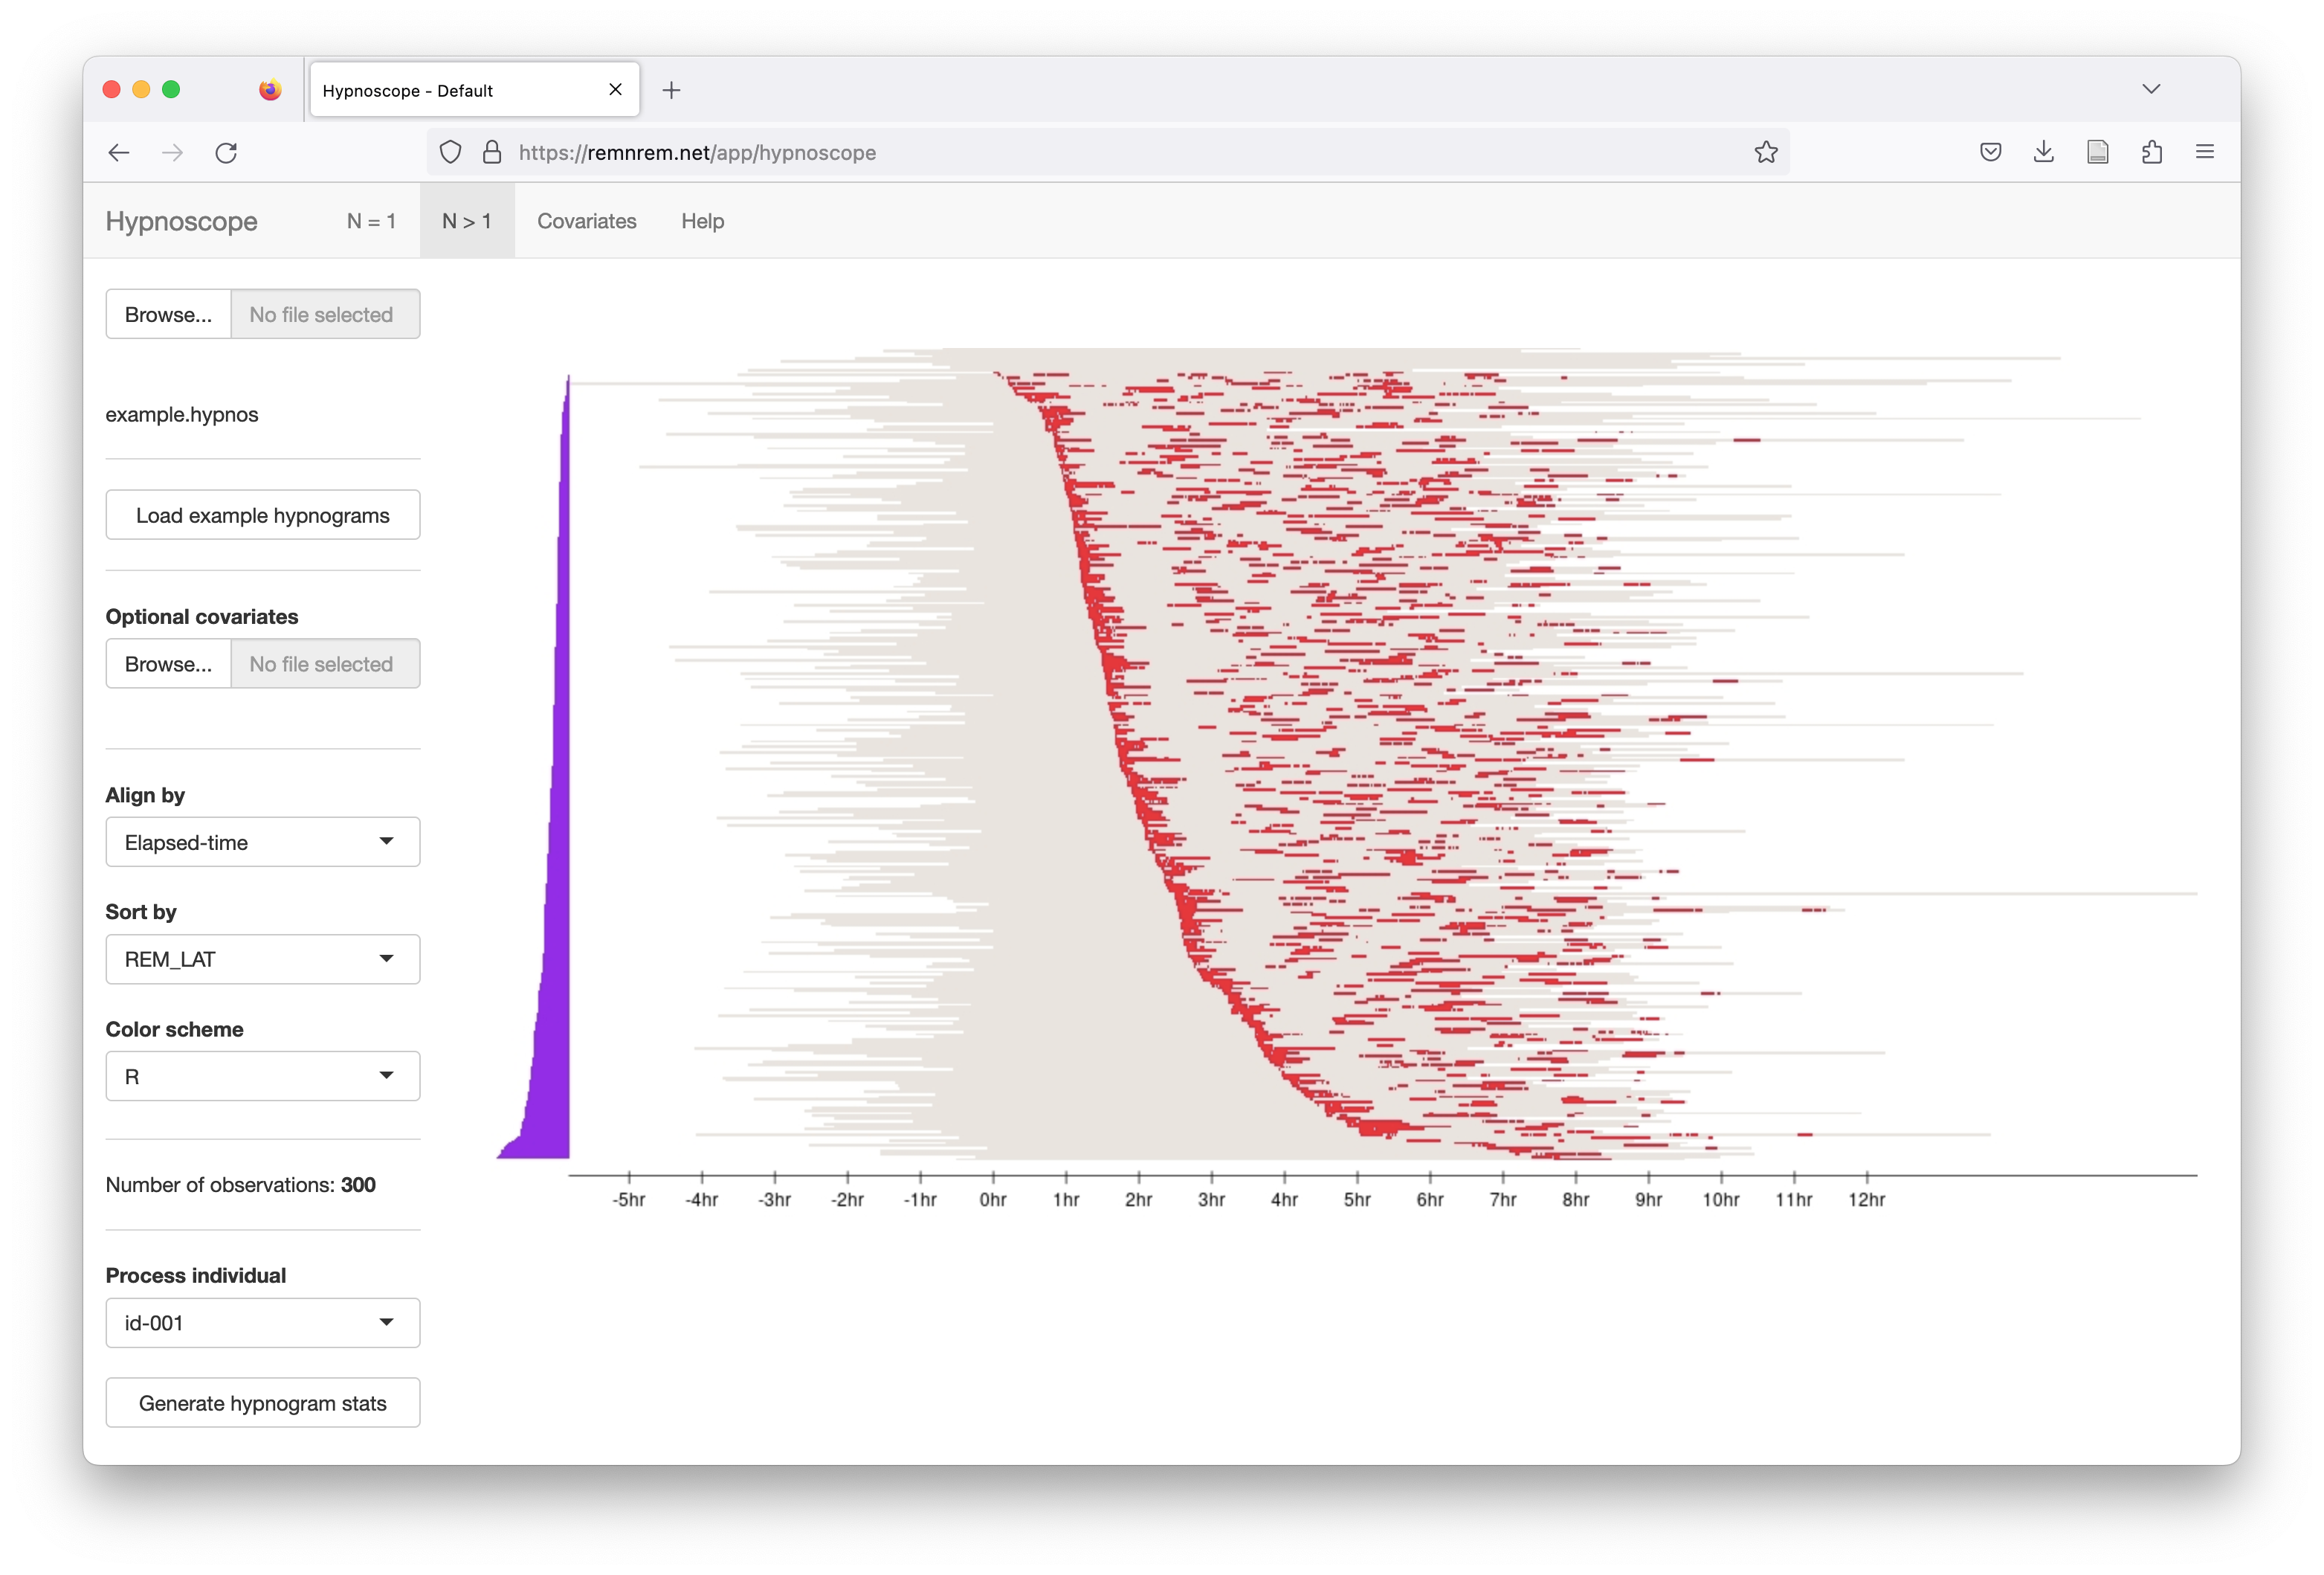
Either upload a file directly, or select Load example hypnograms to see Hypnoscope with examples from the NSRR:
After clicking to load the example data, it will take a little while to load and pre-process the data, especially for large studies.
Example data
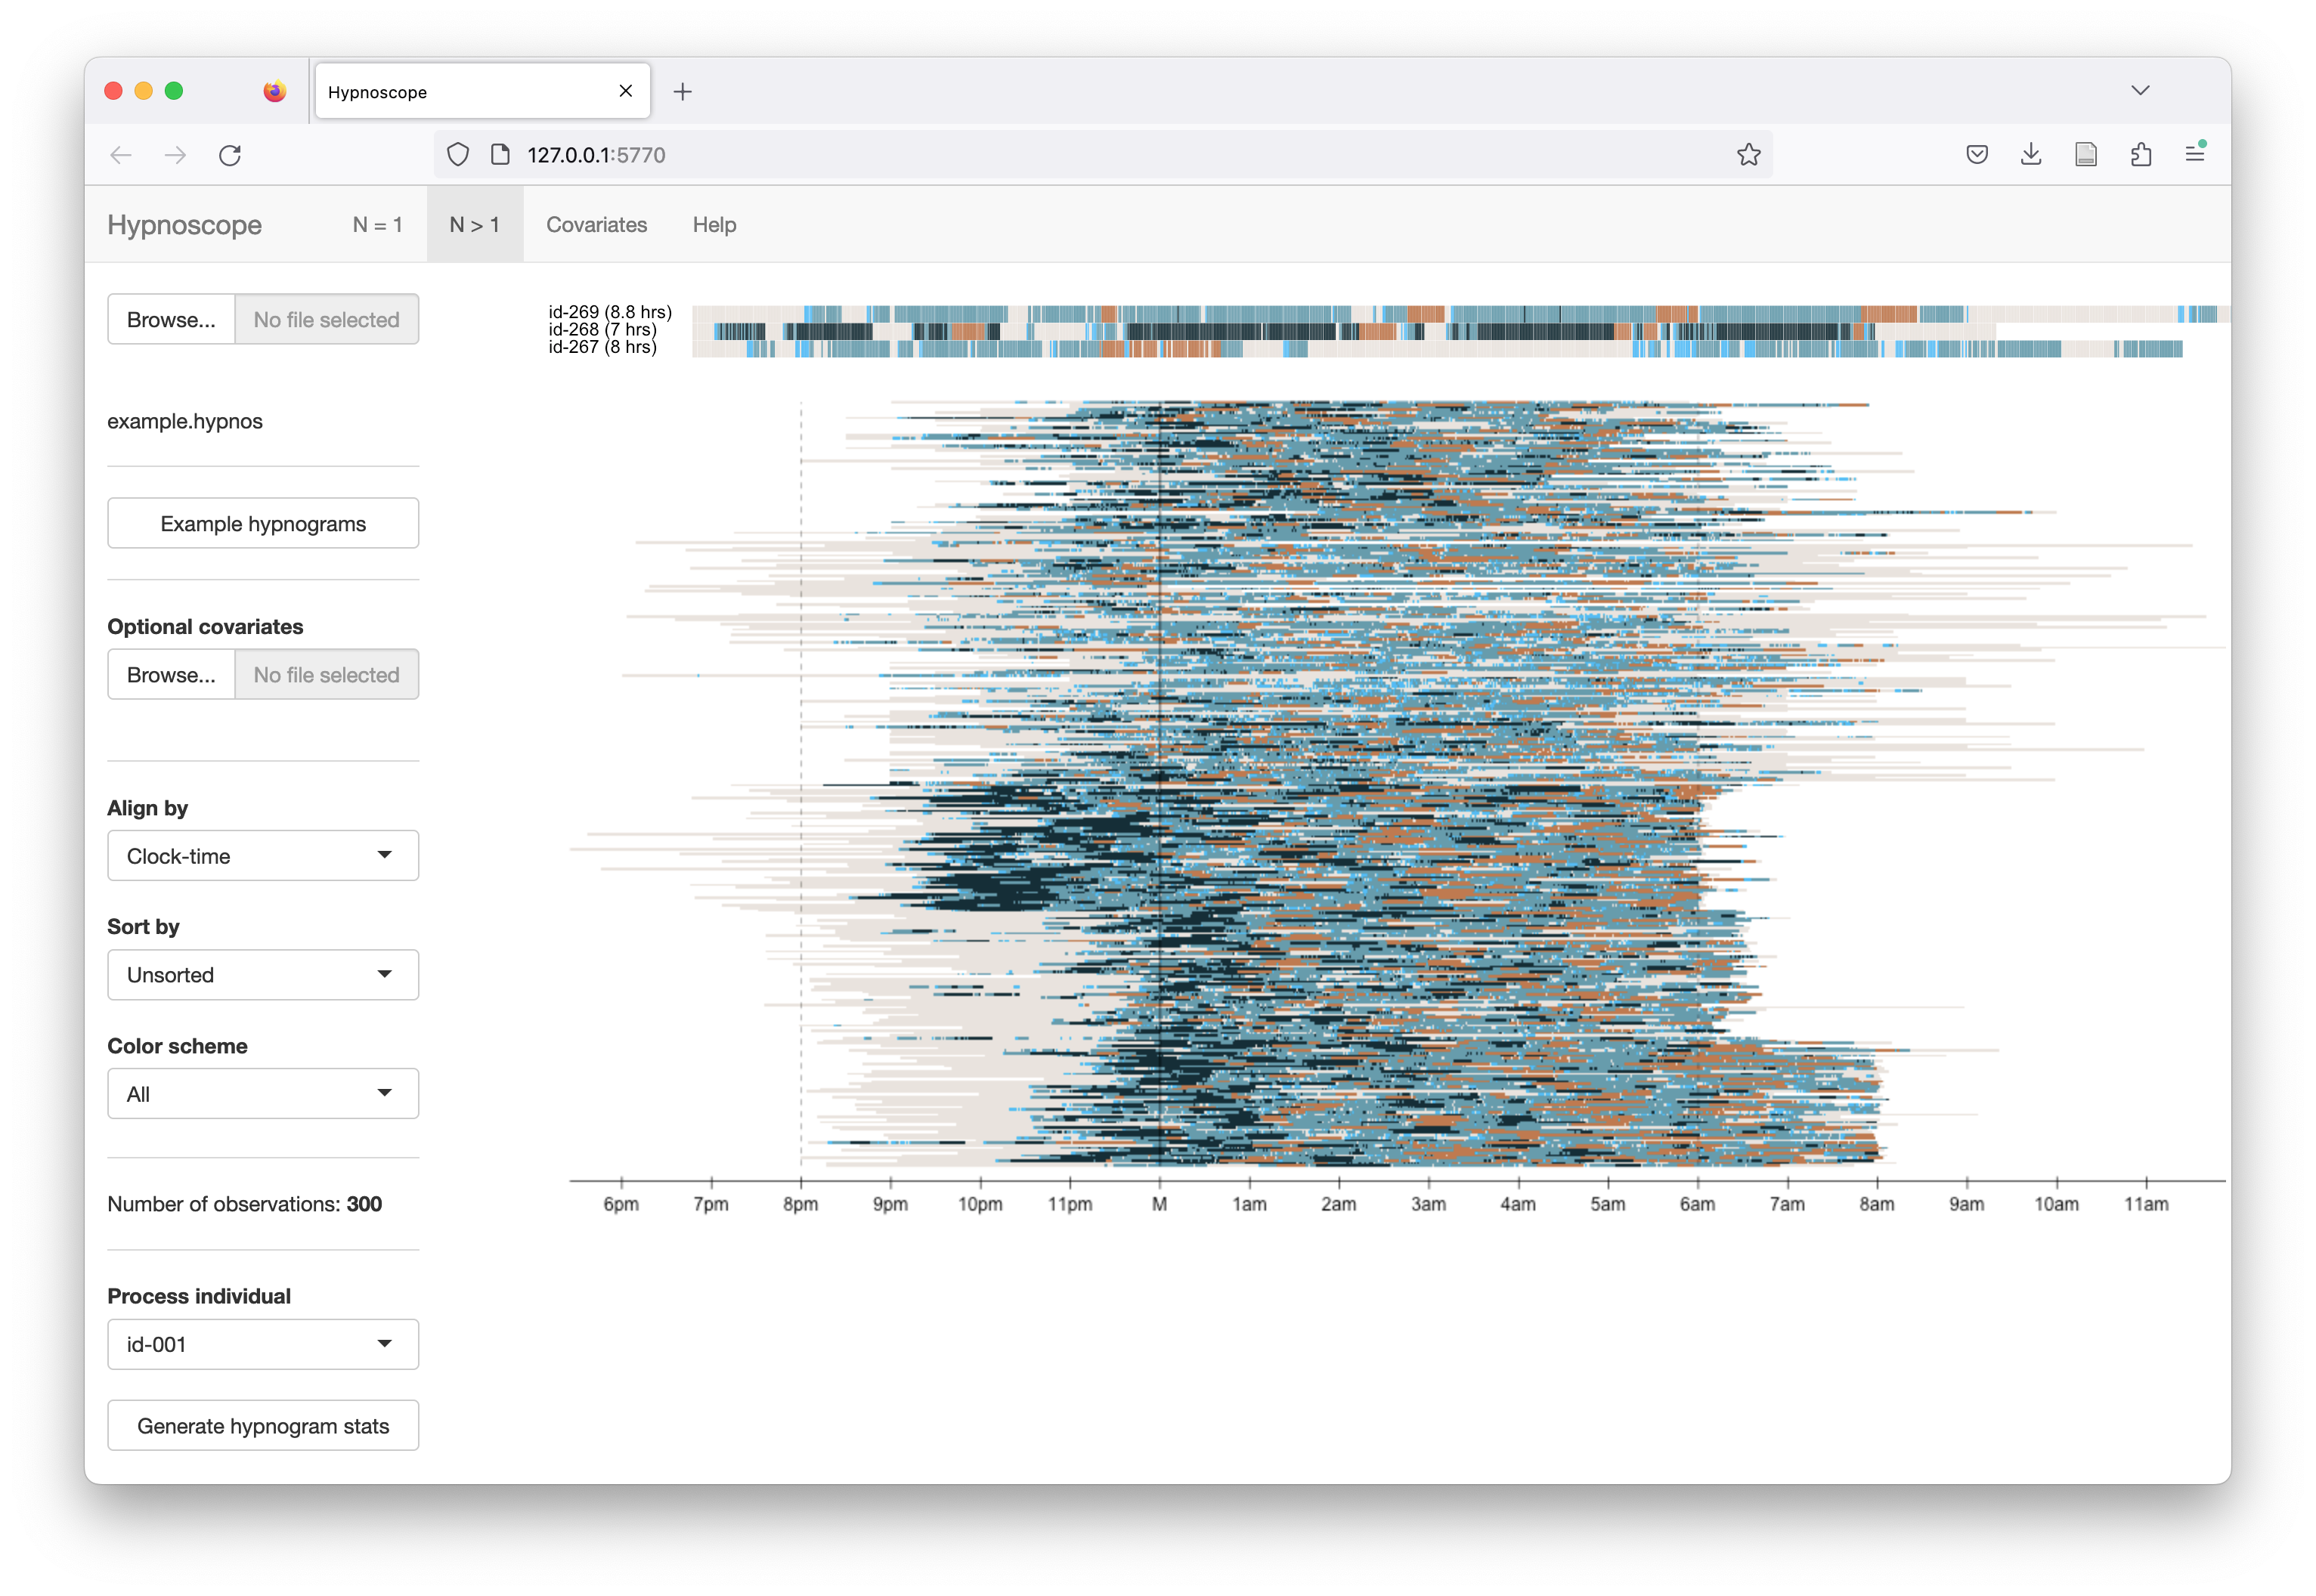
The example hypnograms bundled with Hypnoscope are from 300 individuals selected randomly from six different NSR R studies. All data have been anonymized (with IDs obfuscated from original NSRR IDs). Individuals are ordered by cohort (i.e. the row order of the plots reflect 50 individuals from each of the six cohorts).
As shown below, by default all hypnograms are aligned by clock-time. Each
individual is shifted so that the black line at M corresponds to
midnight for all individuals (even if studies start after midnight).
If you hover the mouse over the image, a standard hypnogram will be
plotted at the top of the screen for that individual.
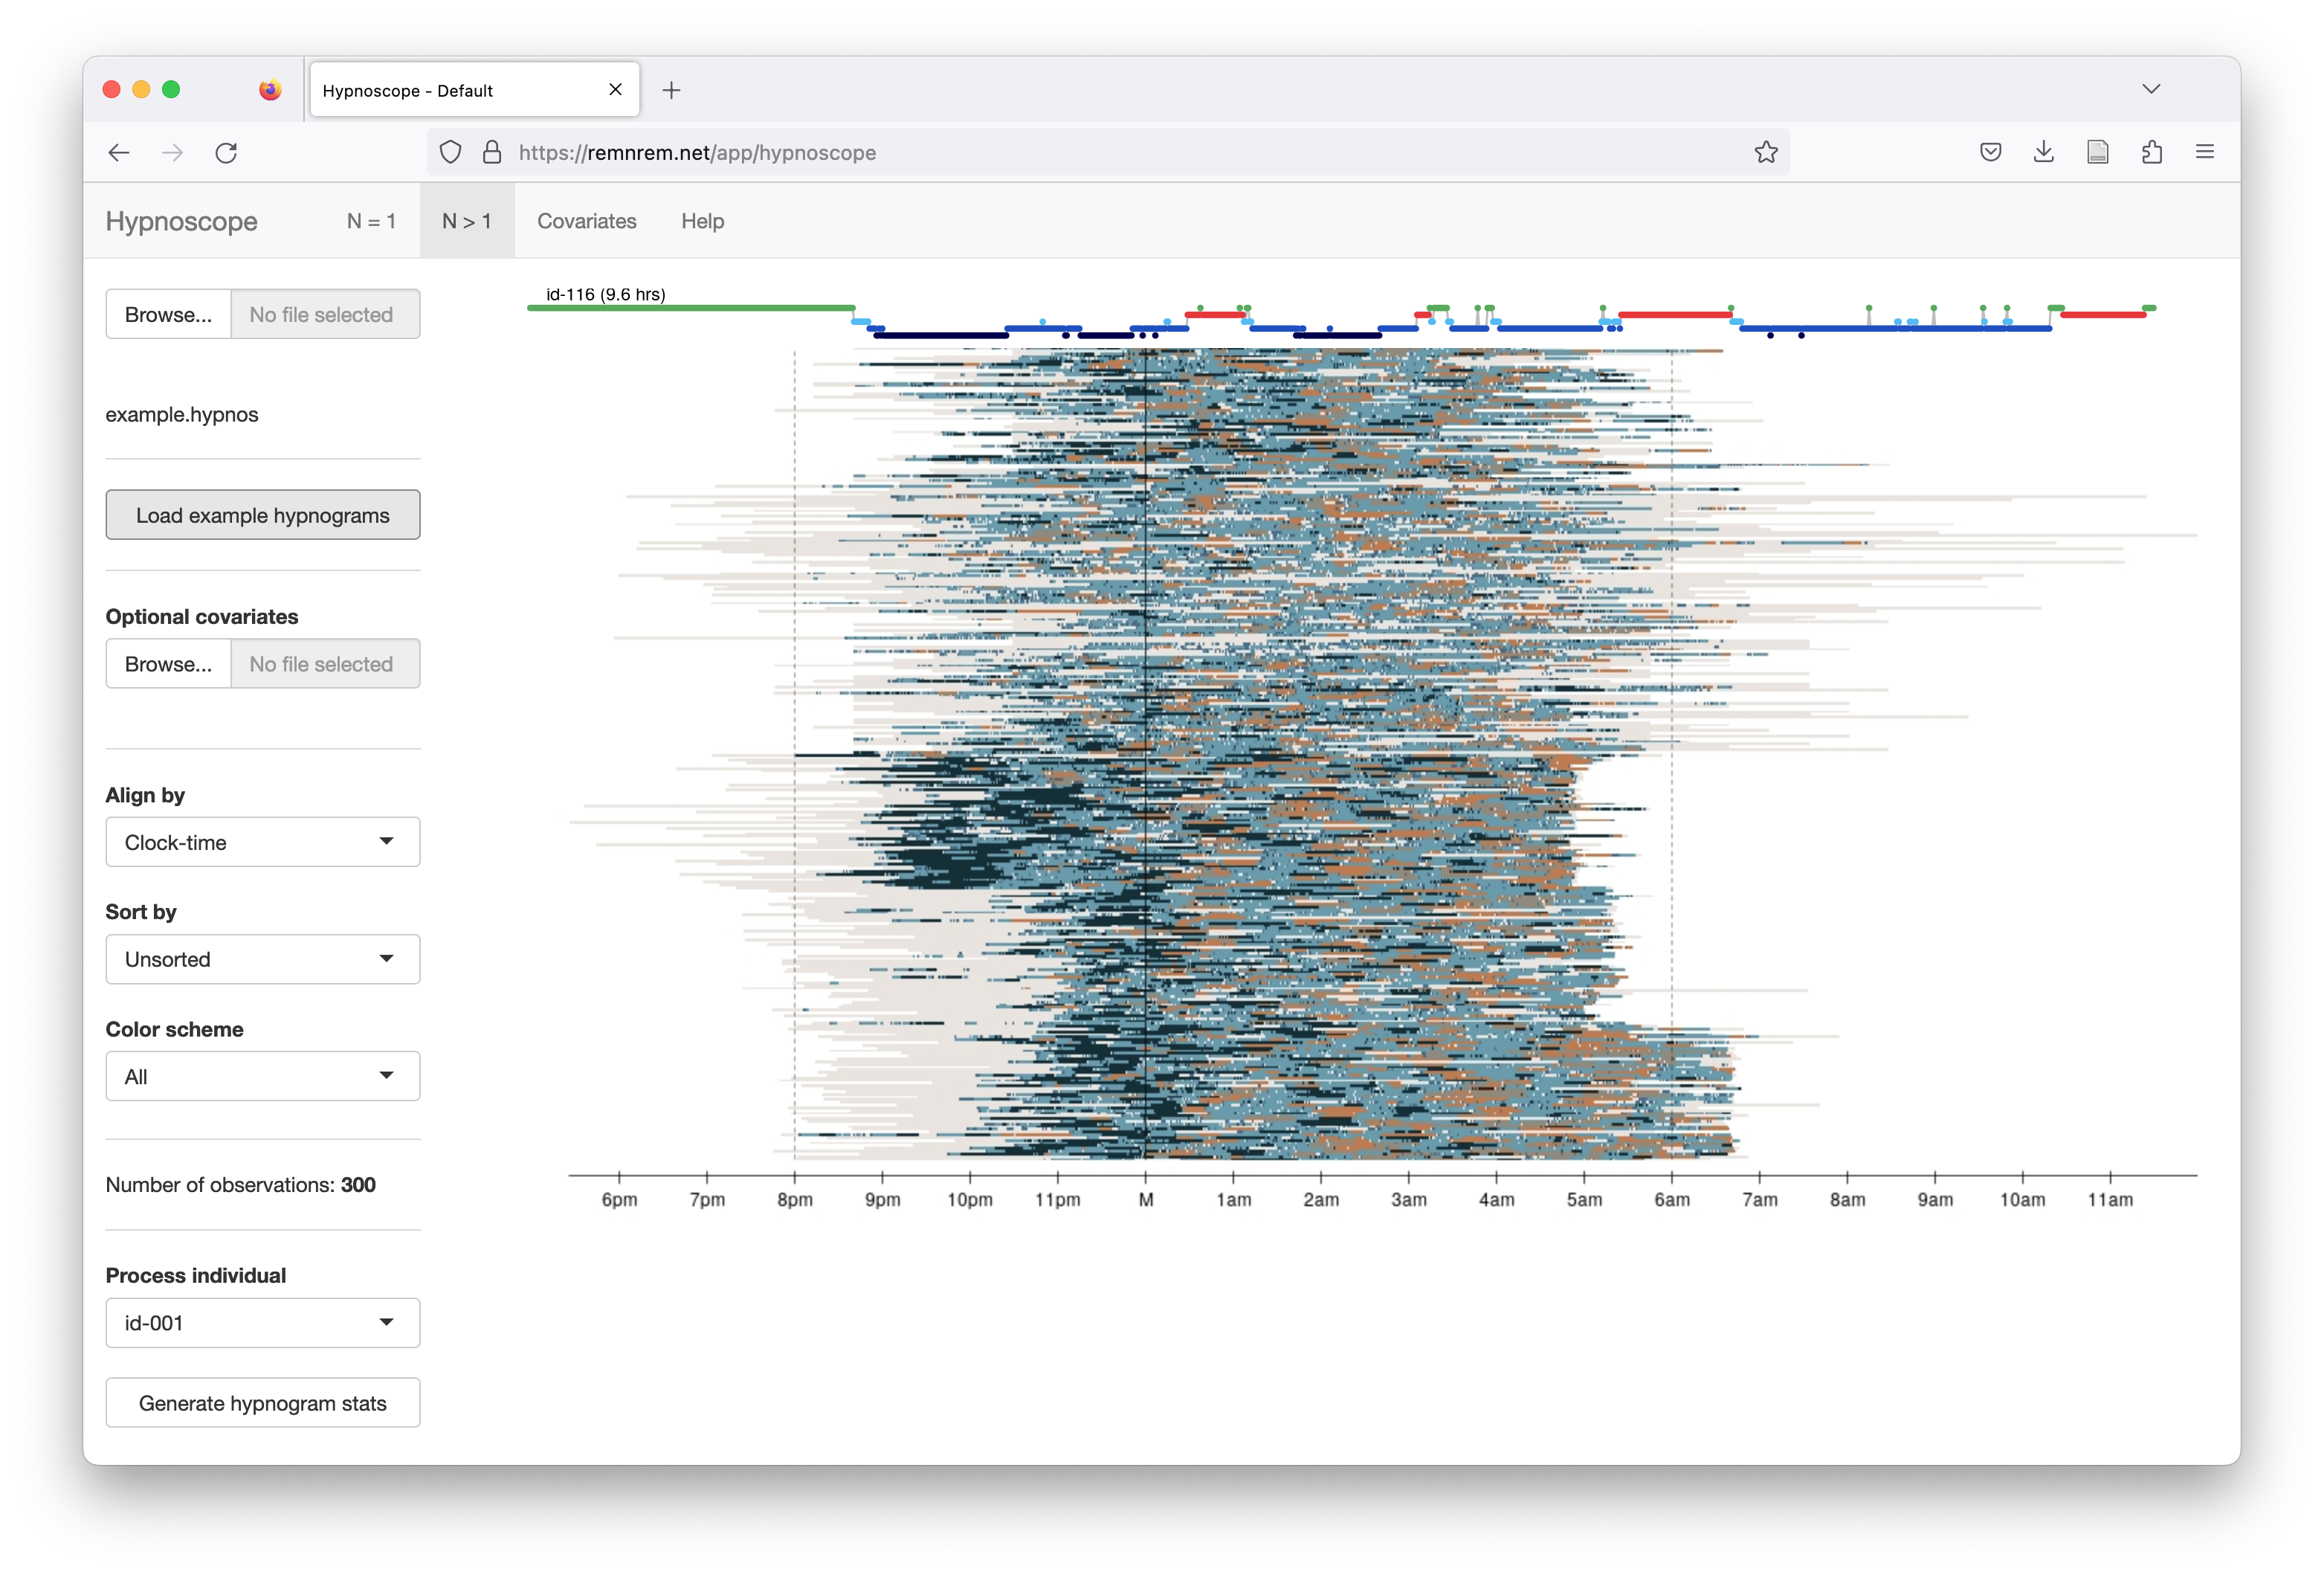
A banding of studies is evident is the above plot, as individuals are ordered by the six cohorts (N=50 from each), e.g. the cohort at the bottom tends to have studies that end at the same clock-time (around 6:45am). Some cohorts are composed of children, some of older individuals - clear differences in the structure of sleep (i.e. more N3, less fragmentation, etc) can be seen between different cohorts, as well as technical differences (e.g. in whether wake periods before and after the sleep period were exported). Hypnoscope plots can be useful ways to point to general properties of cohorts including oddities that might not be evident from statistical analysis of hypnogram statistics.
Color schemes
Note that unlike Luna's standard color scheme (used in the N=1 mode), here (under the default view) REM is orange rather than red; also, wake is gray/cream rather than green. These changes were made to enchance the visual qualities of the condensed hypnogram plots.
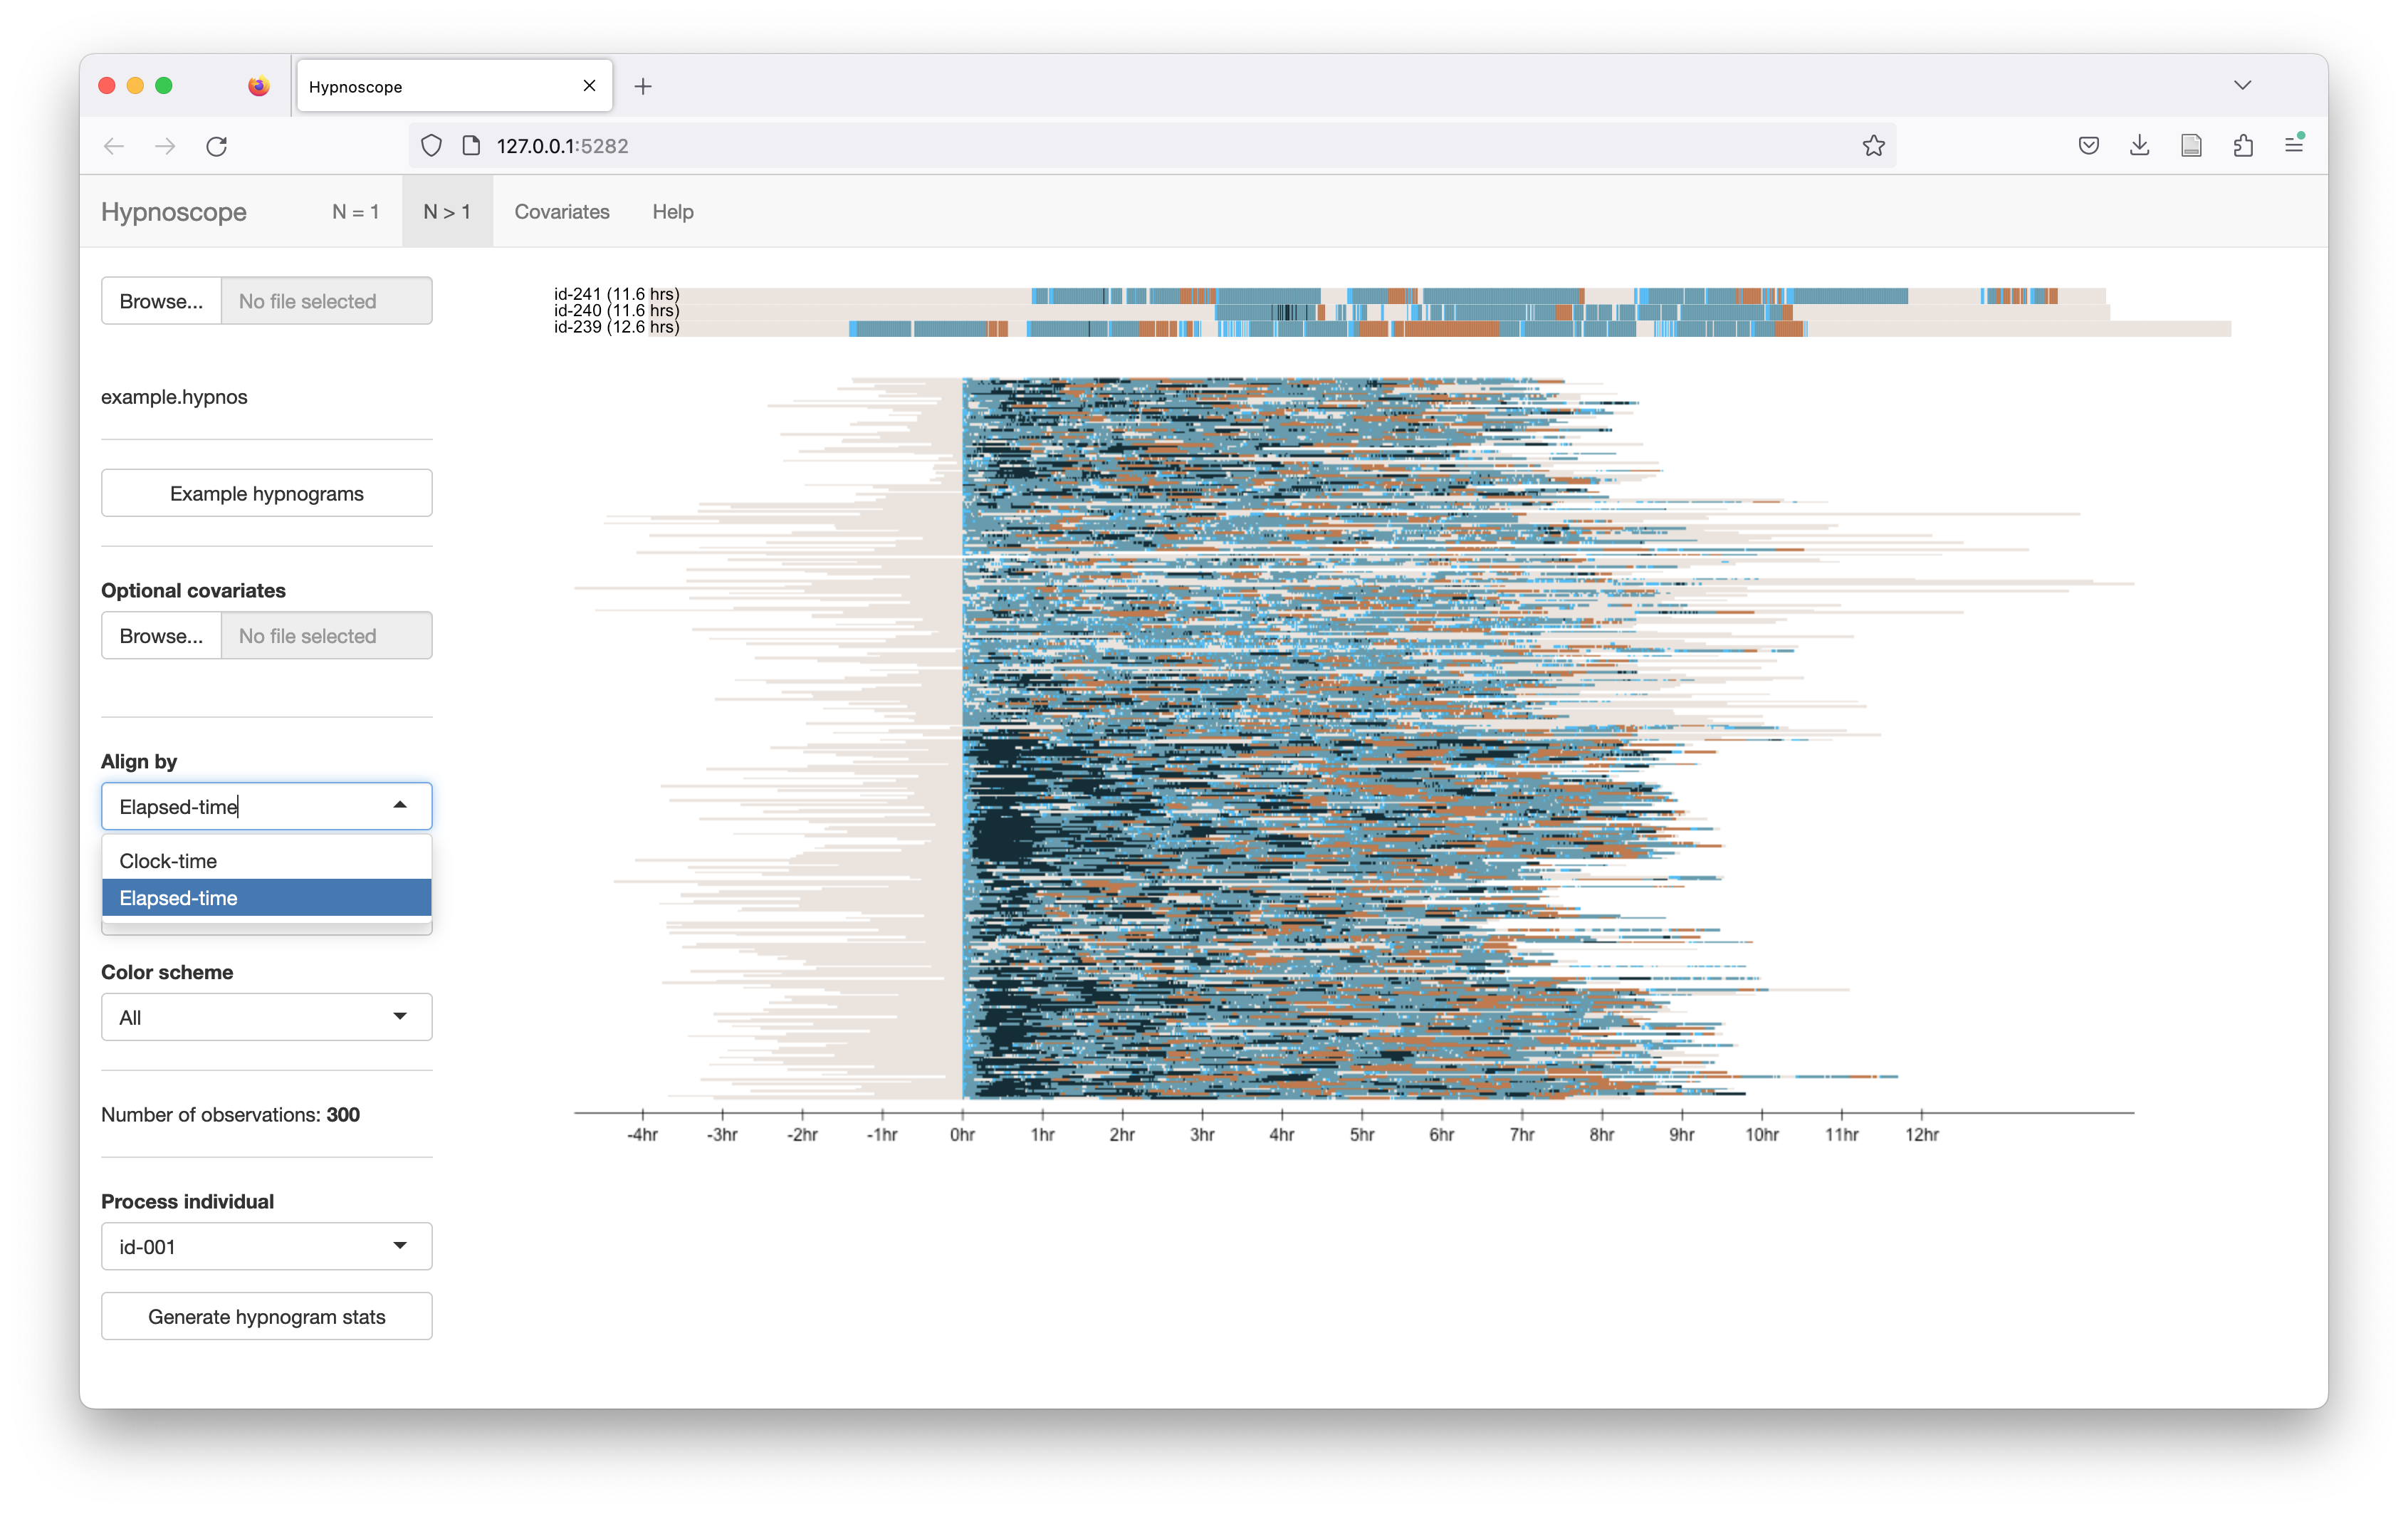
To change the x-axis alignment, select the Align by control and pick Elapsed-time. Now all studies are aligned such that sleep onset occurs at the same point (0 hours):
Ordering rows/individuals:
The Sort by control can be used to change the order of the main plot. The options will include
-
Unsorted (actually individuals will be sorted alphanumerically - the default), by sleep onset (clock-time), and by the start of the recording (clock-time).
-
Additionally, if any covariates have been attached, the columns of the file will appear as menu items here, e.g. to order individuals by age, etc, or other (pre-computed) hypnogram properties (e.g. sleep efficiency).
In this example (which uses clock-time alignment), the rows are sorted by sleep onset (i.e. individuals with later sleep onsets are plotted below those with earlier sleep onset times:
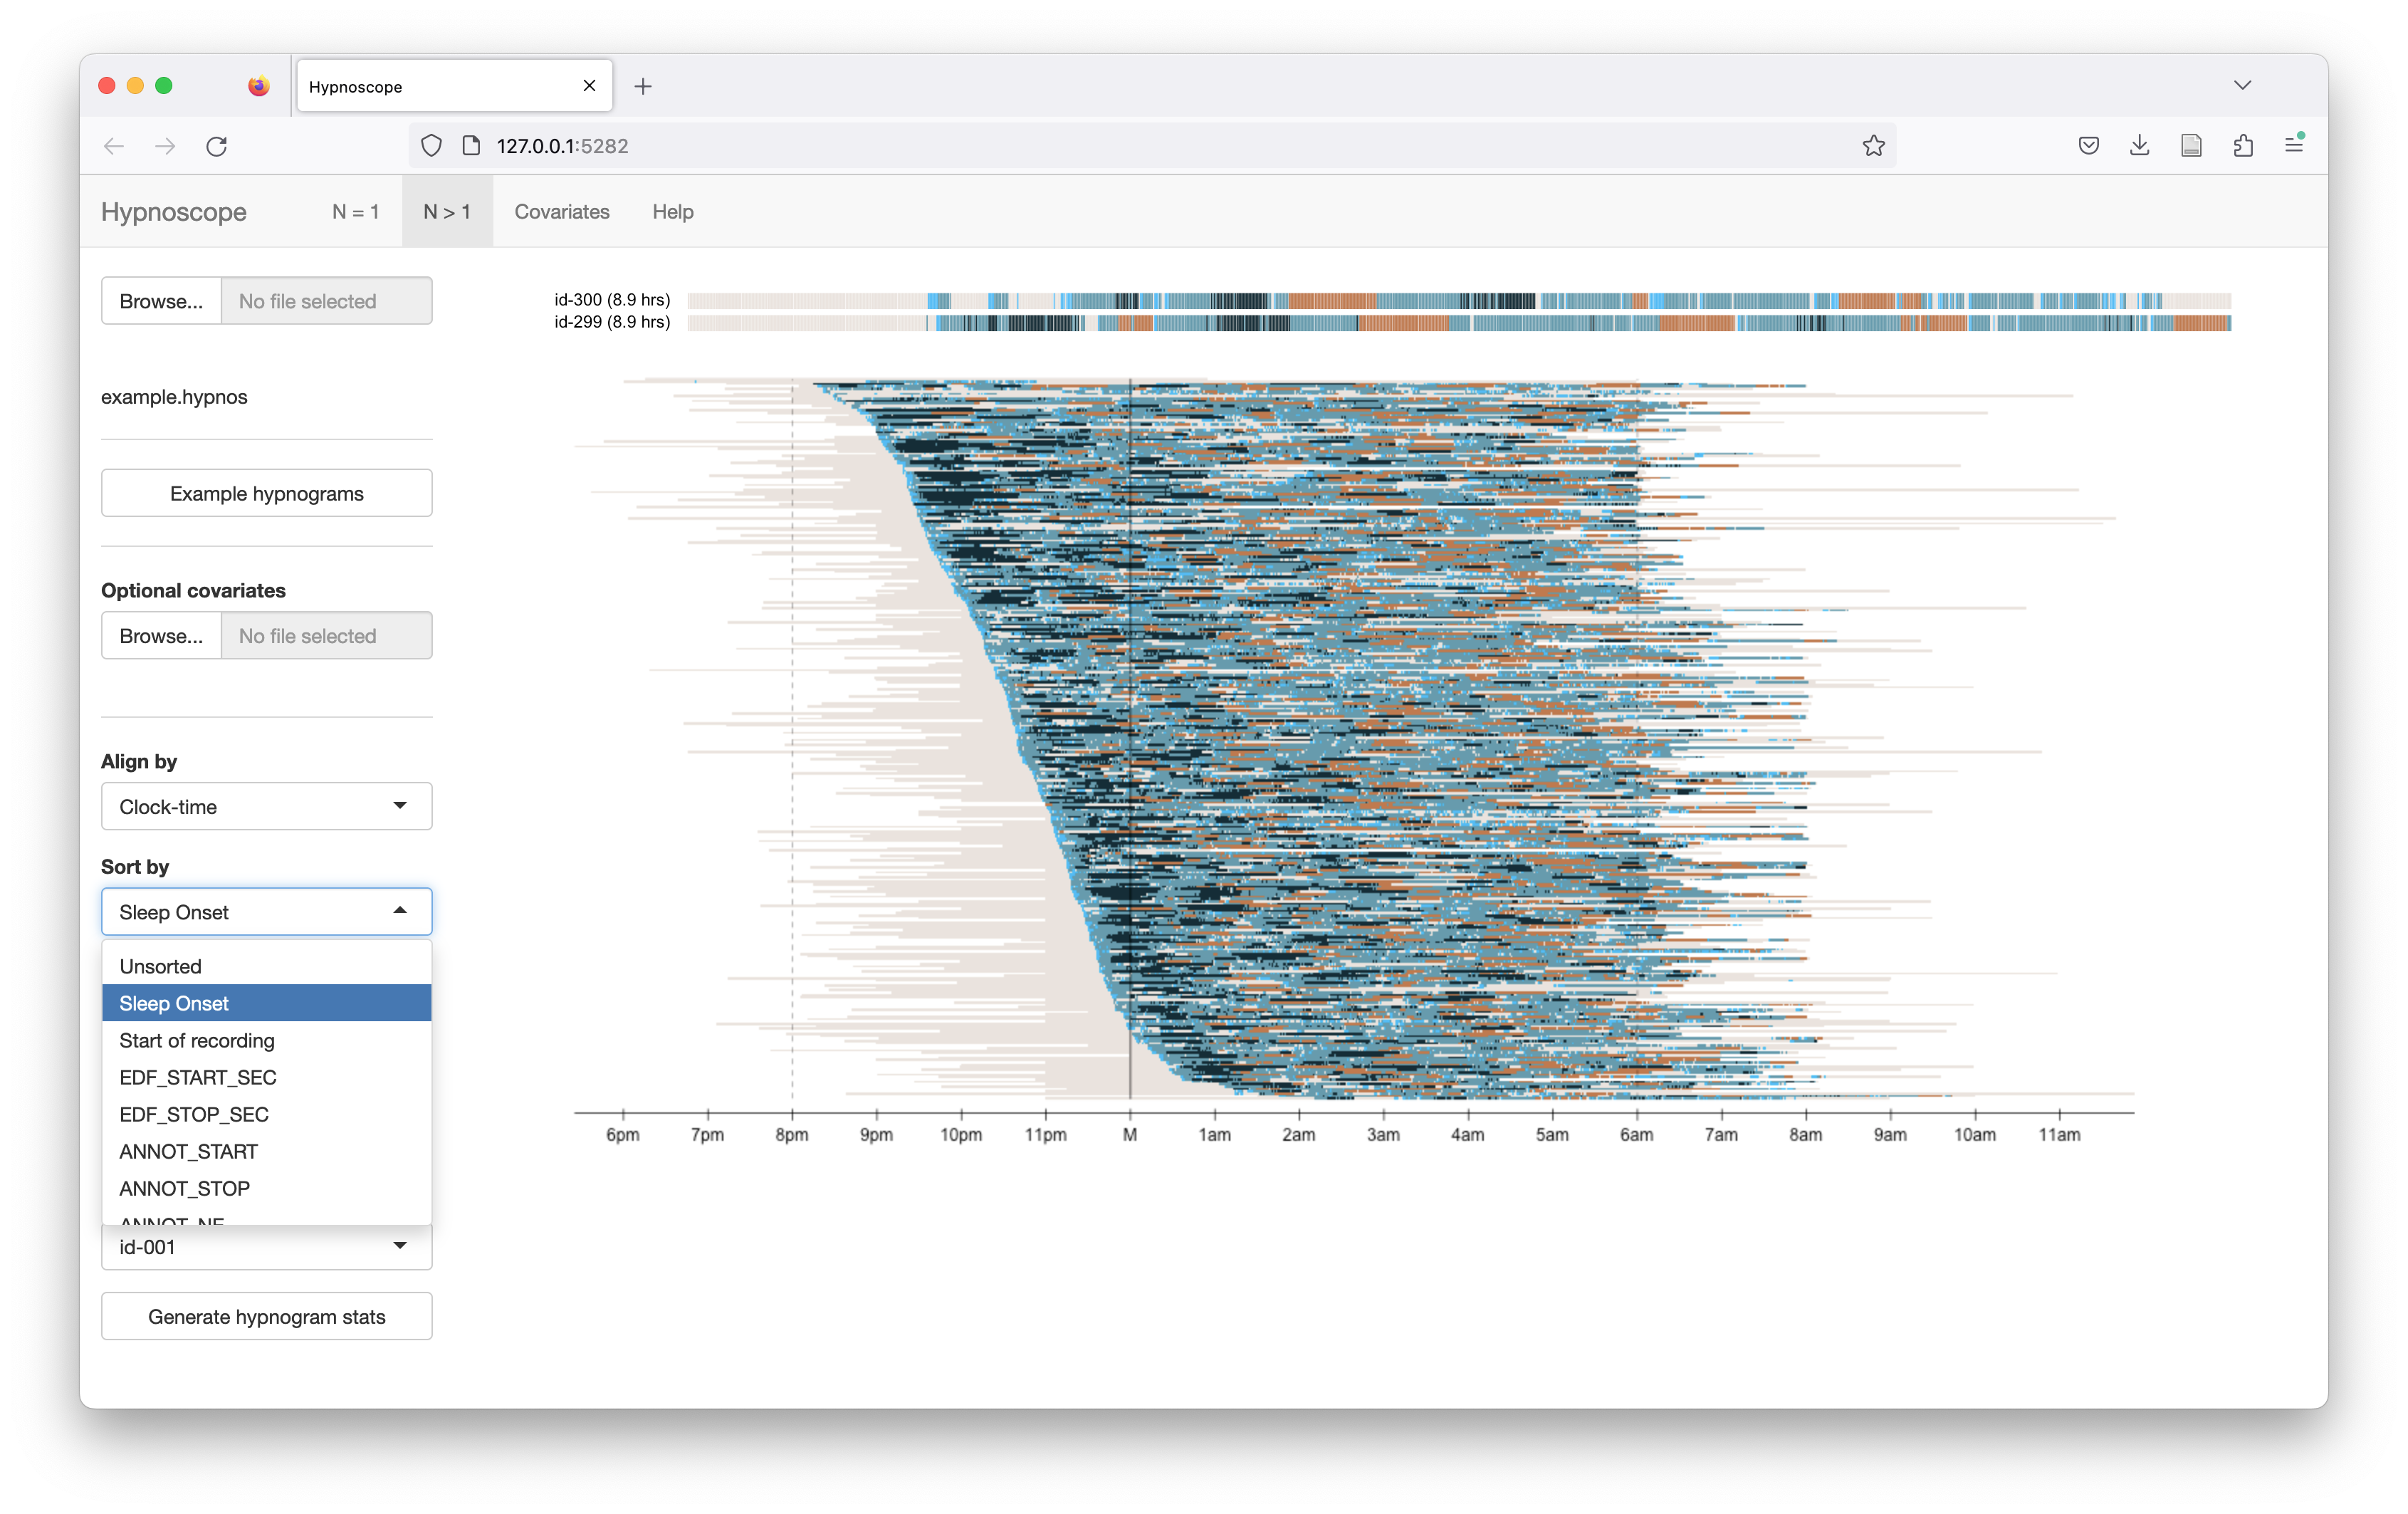
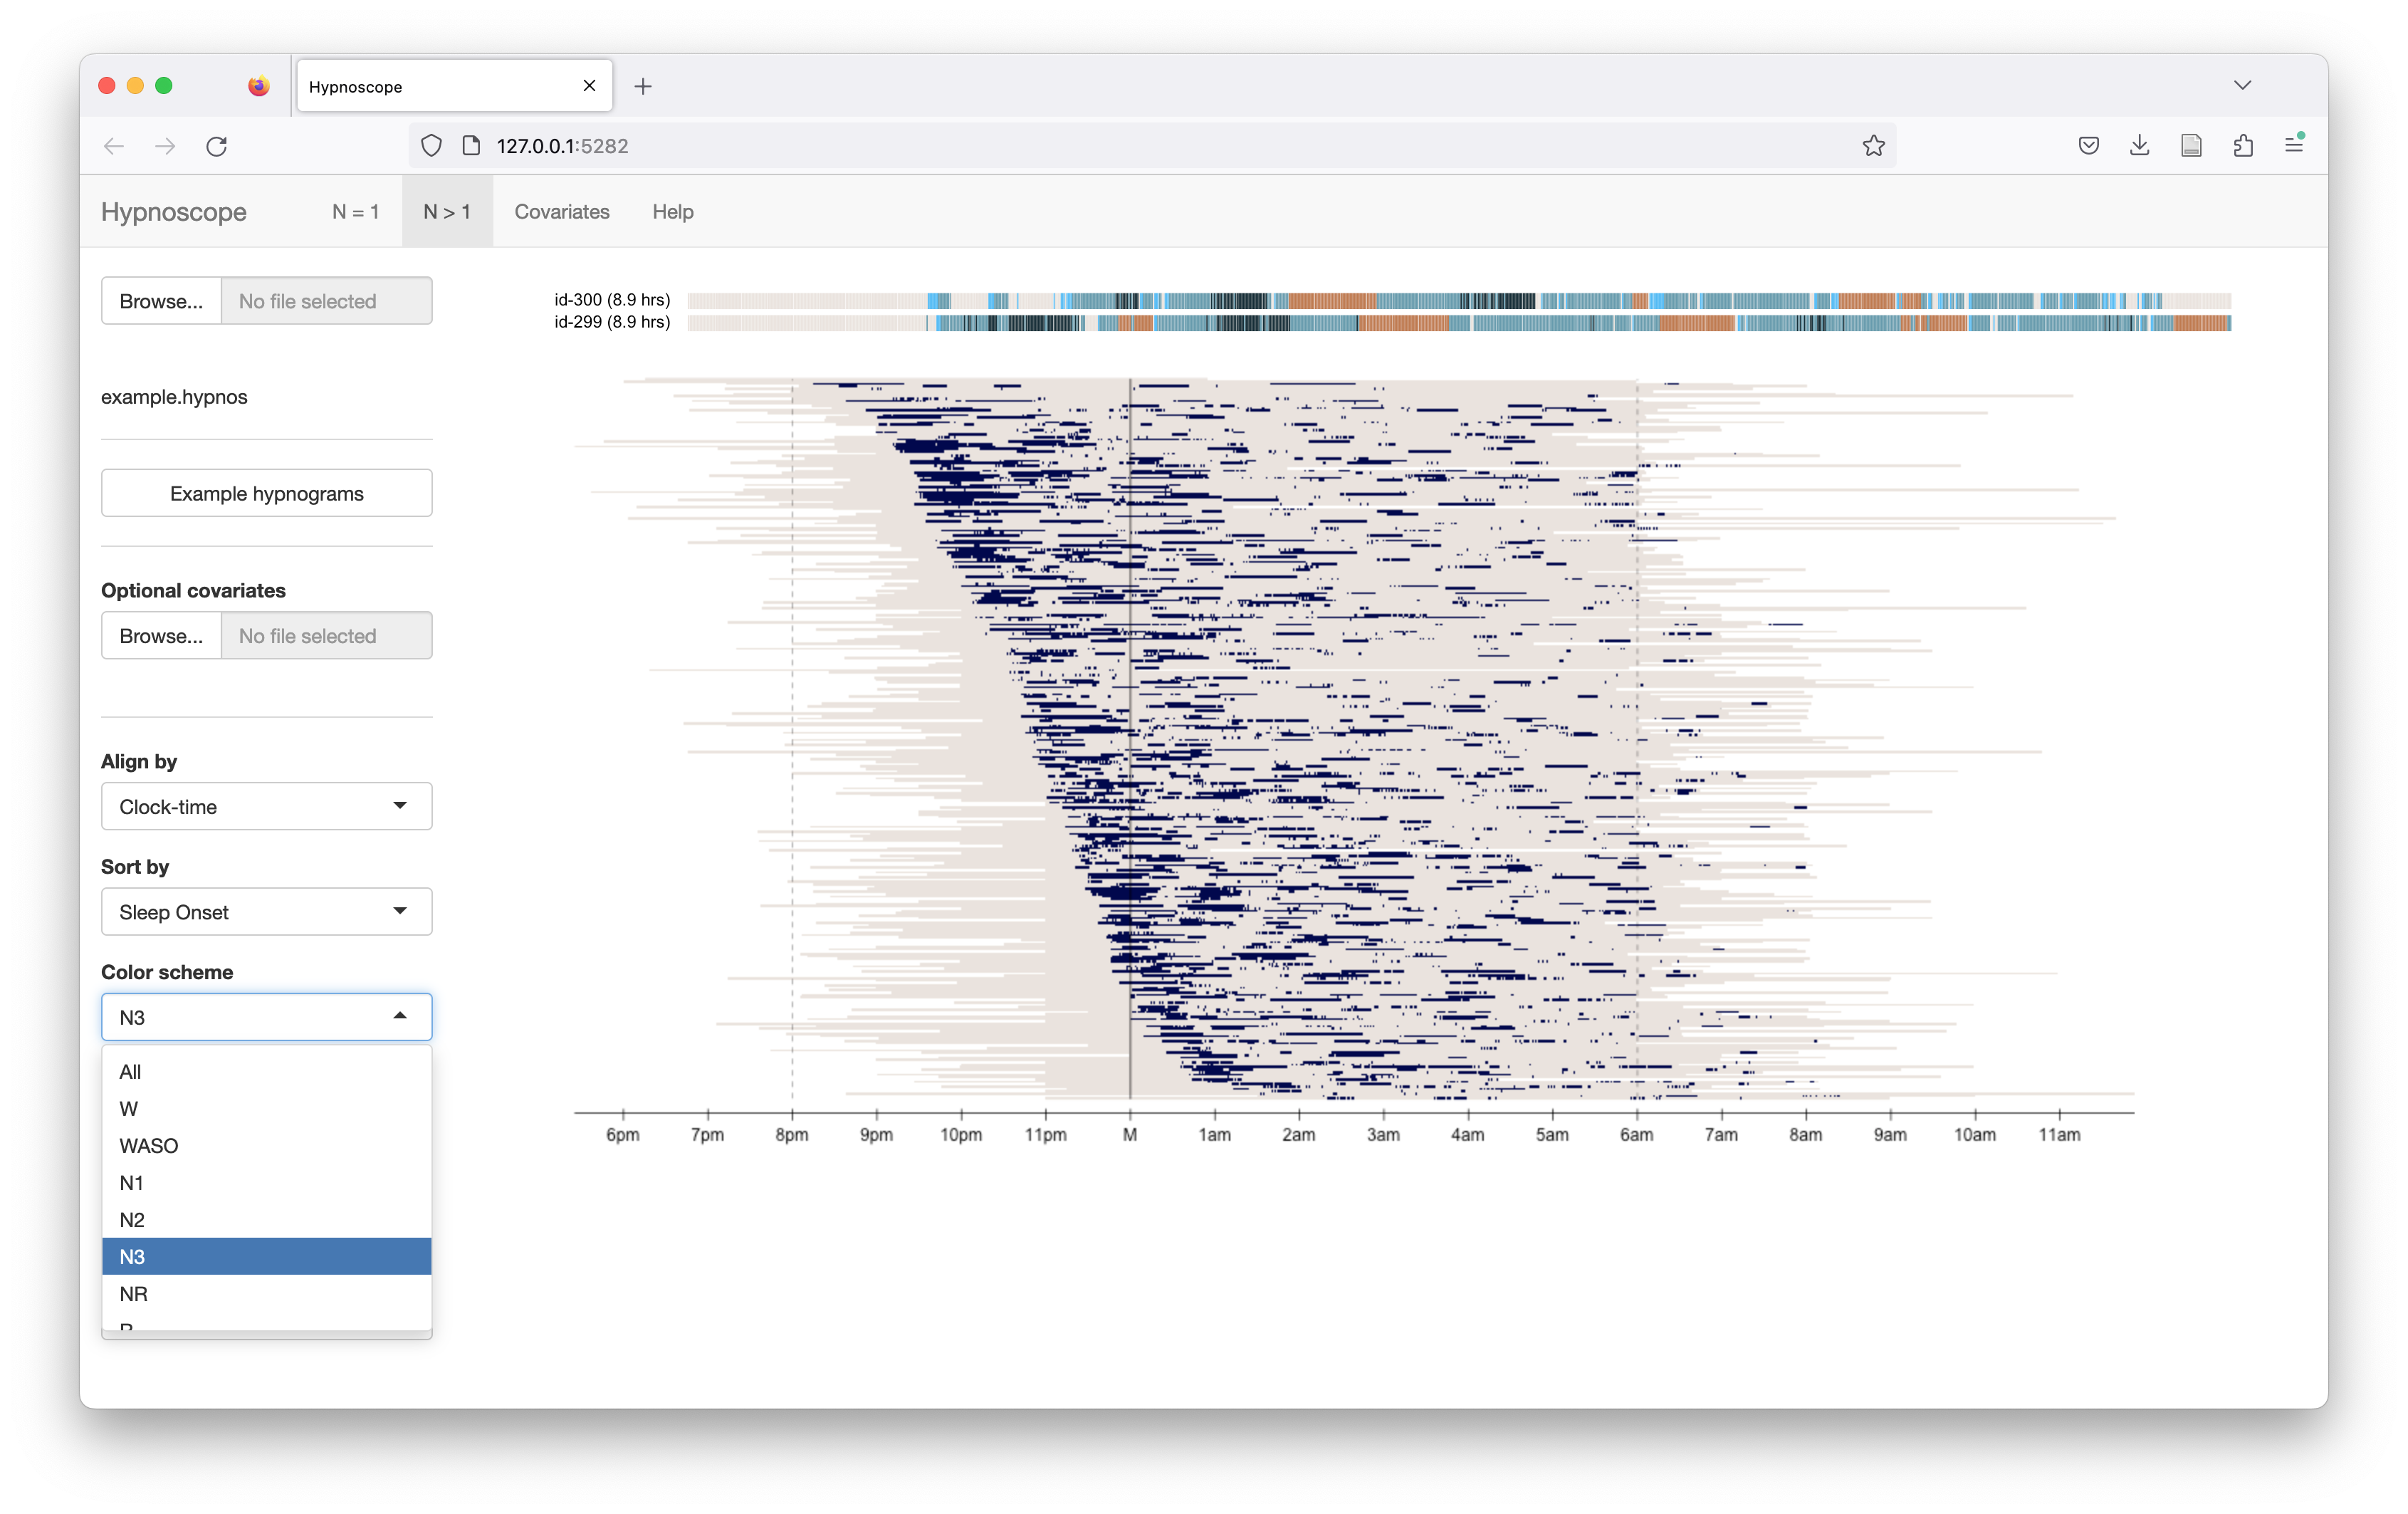
Restricting stage/color palettes
Selecting options from the Color scheme list (left panel), here we restrict to viewing the same data/view, but only N3 epochs highlighted:
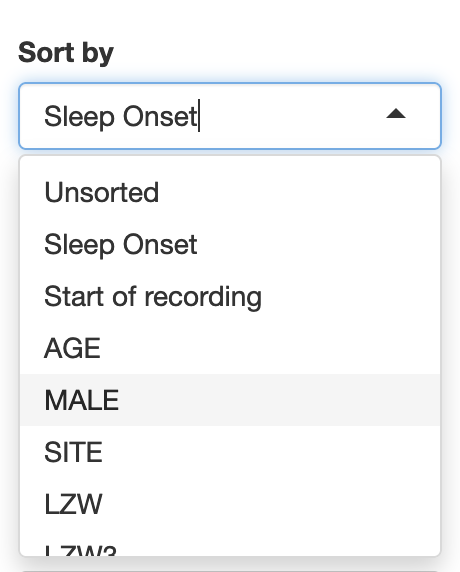
Sorting individuals
By default, the Sort By list can select to order individuals by either sleep onset clock-time or recording start clock-time. If other covariates are attached, these will additionally populate the Sort By tool:
This view sorts the individuals (rows) by REM latency, aligning recordings by elapsed-time (rather than clock-time) and
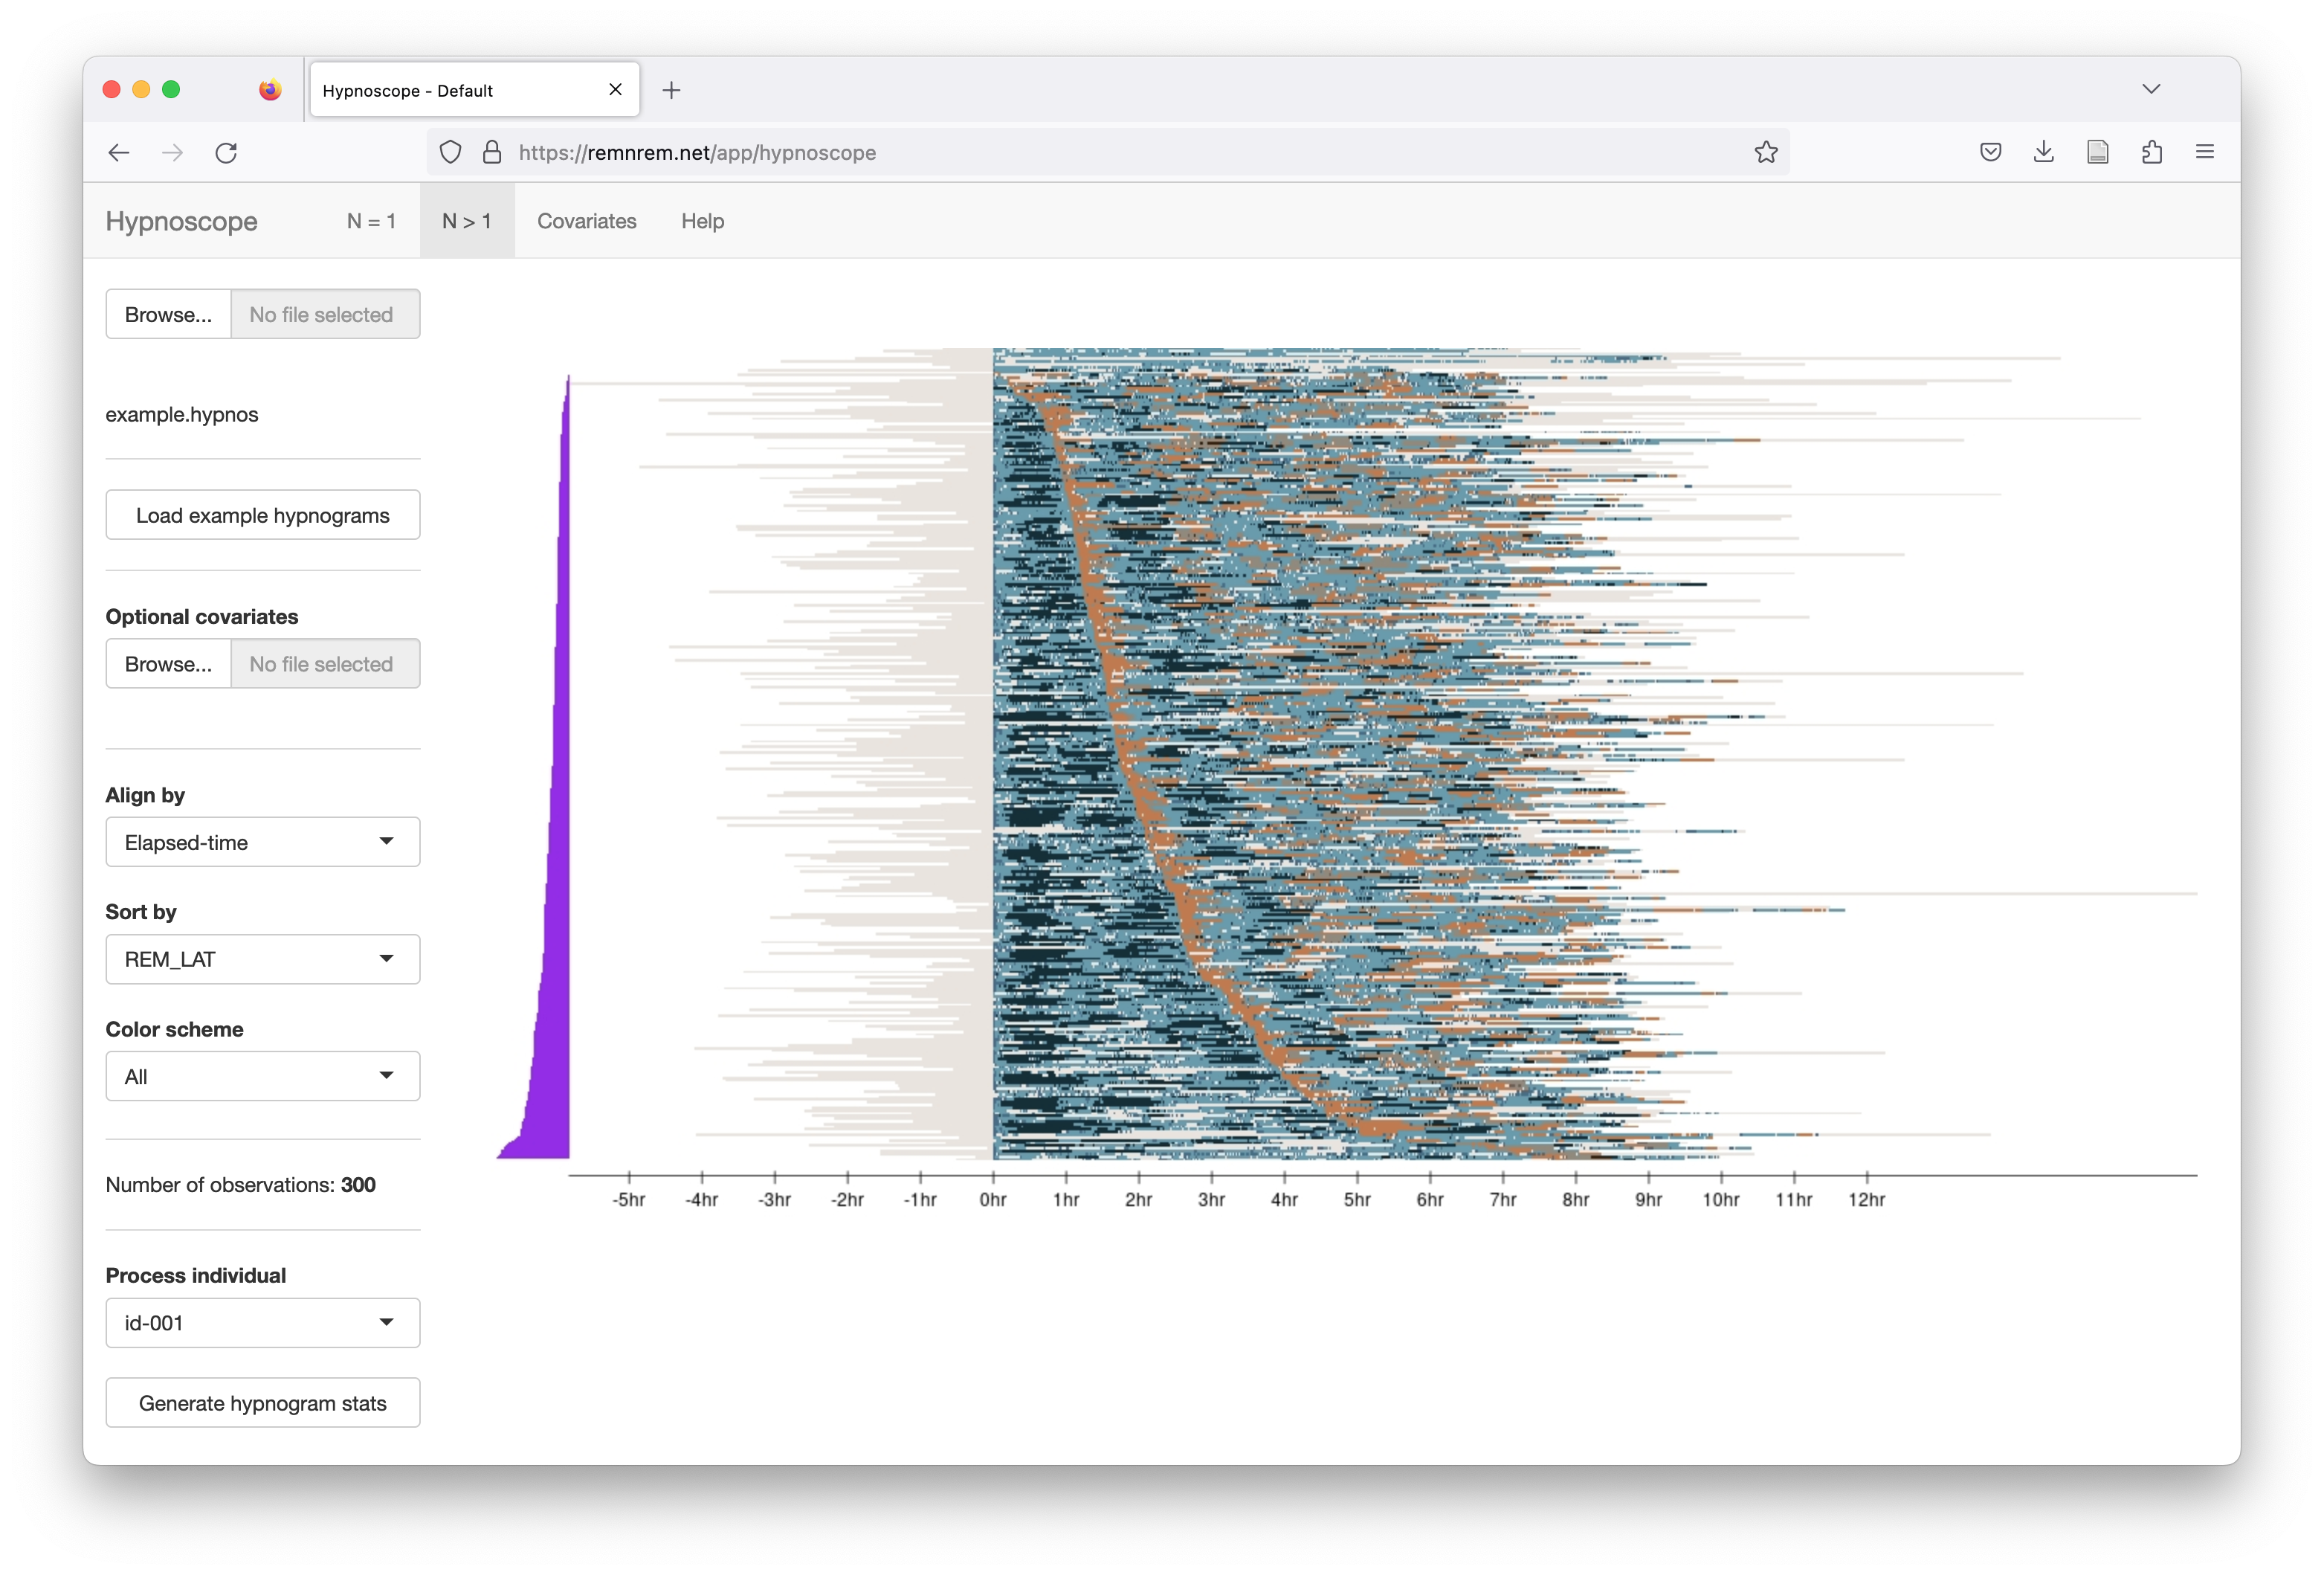
The same plot, but now selecting only REM epochs to be shown:
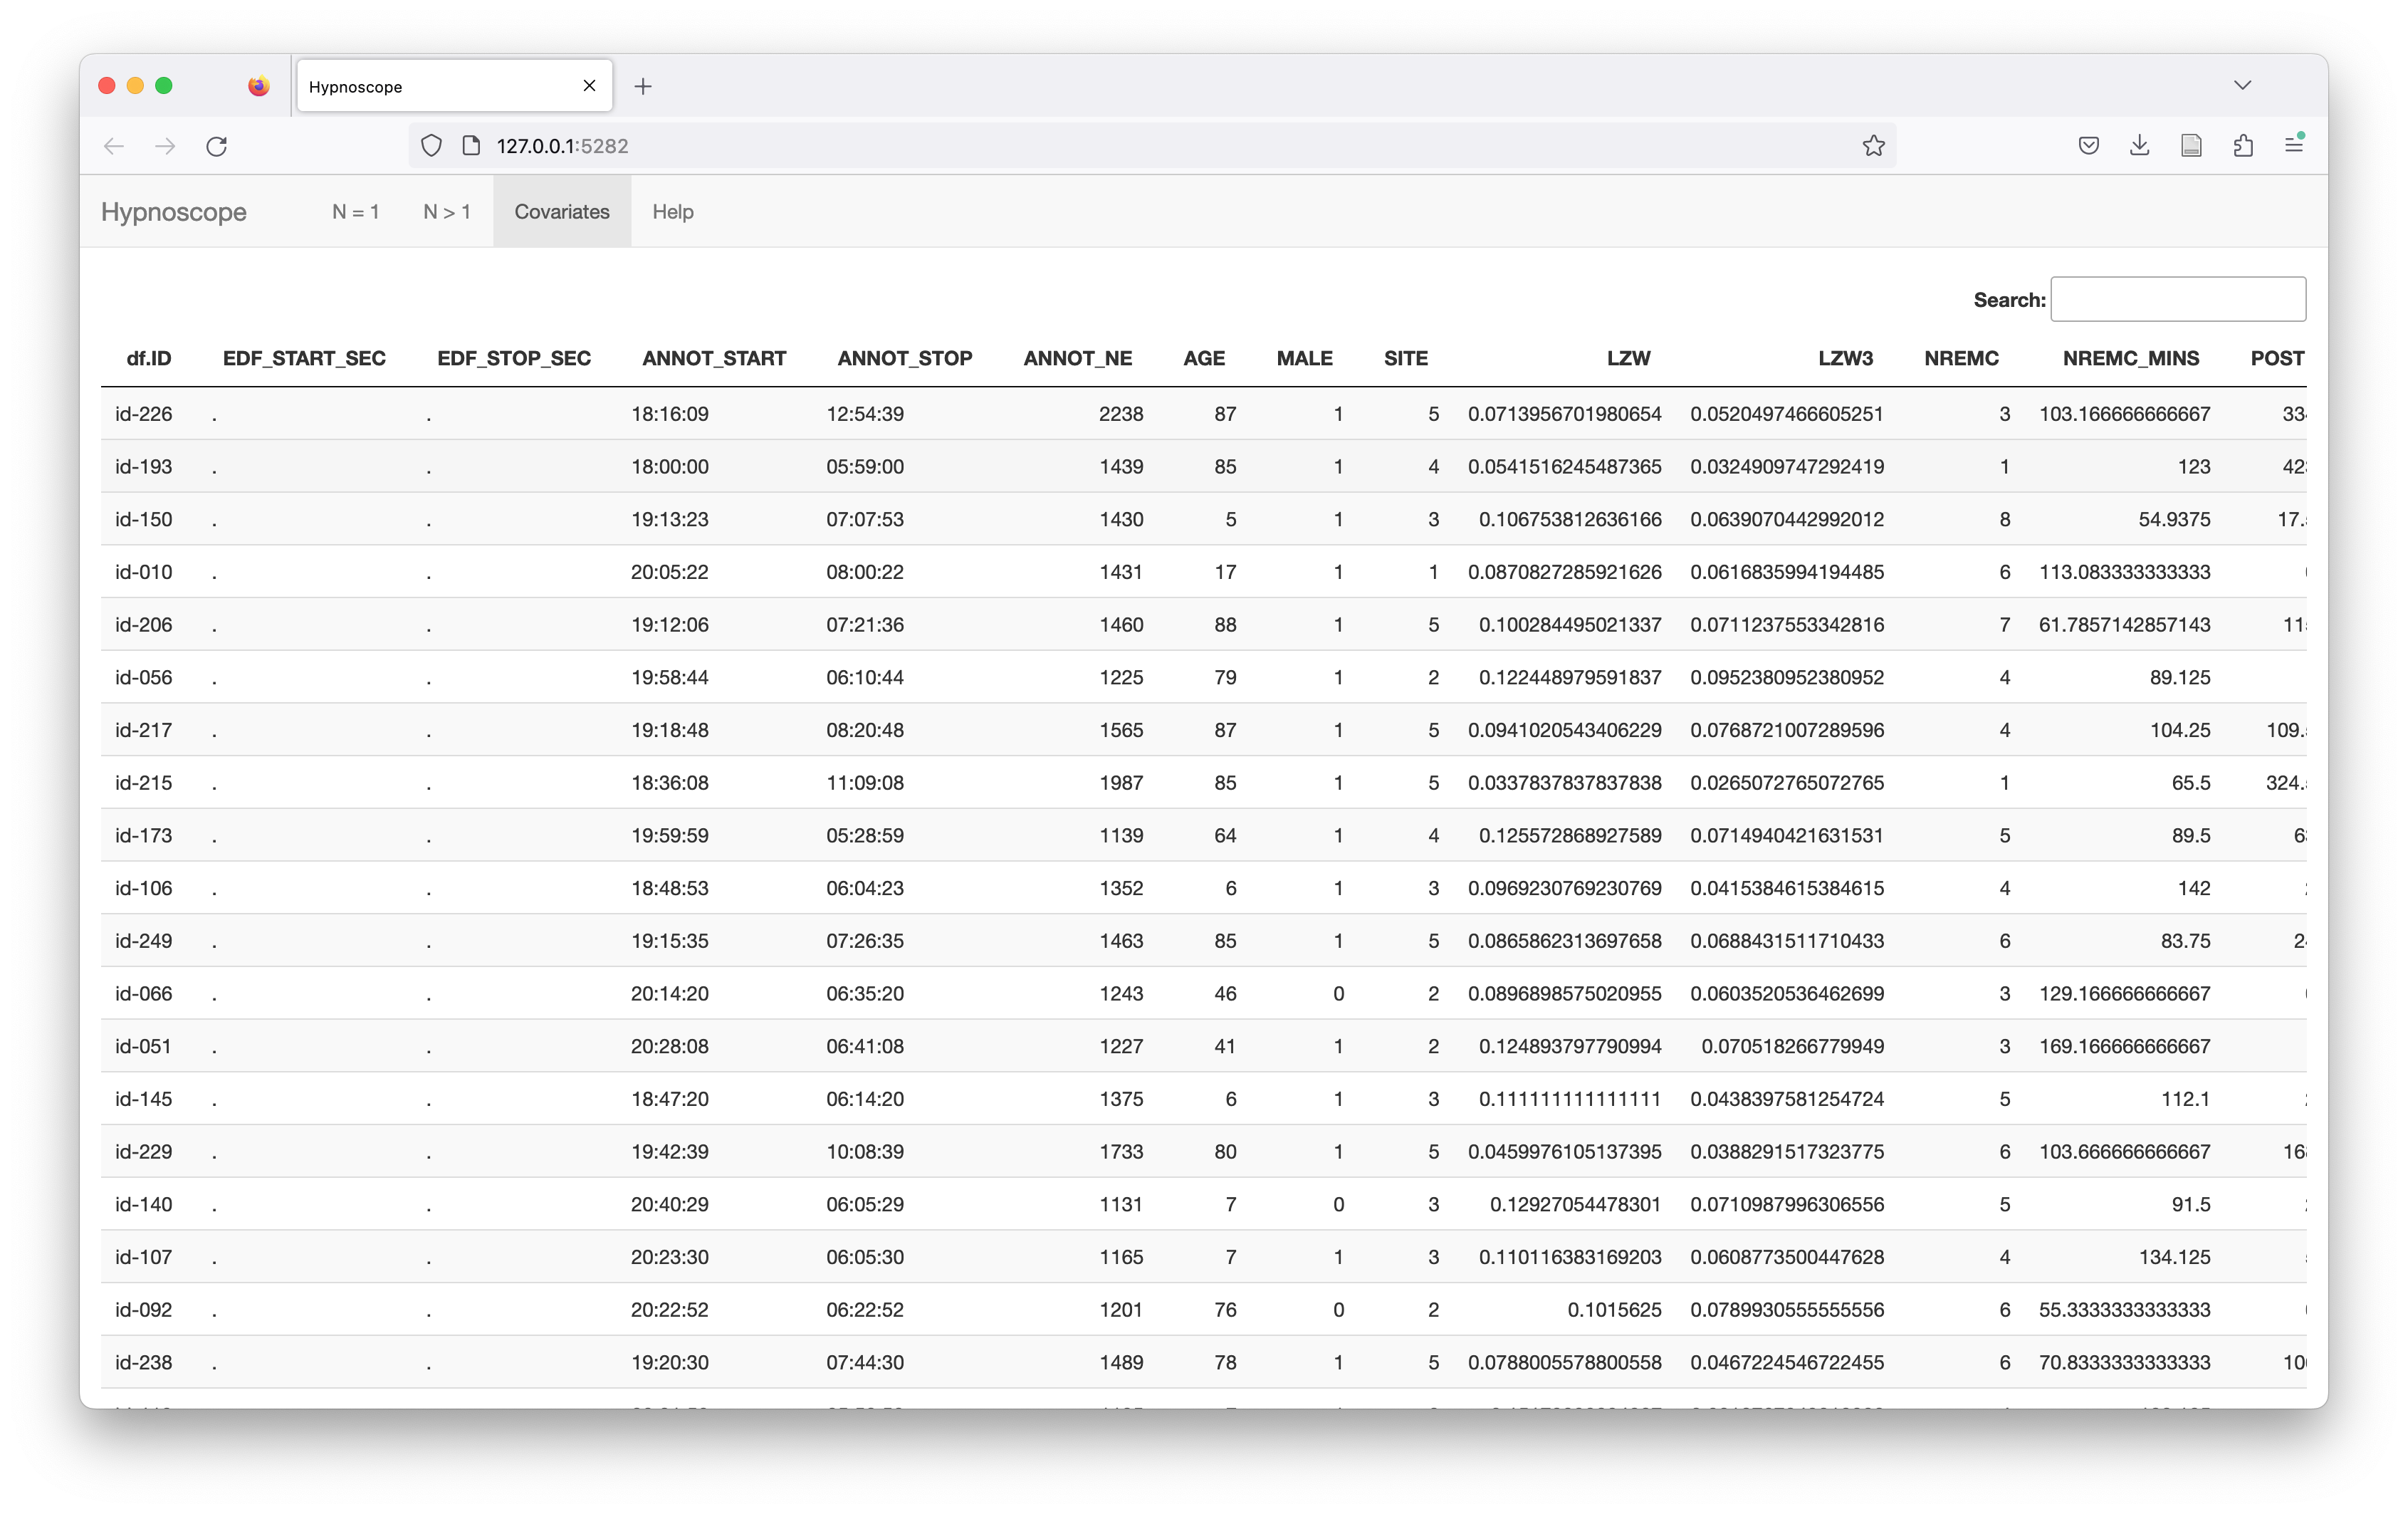
After sorting the individuals, this changes the corresponding table in the Covariates panel too:
Generating individual hypnogram metrics
You can hover over the main plot with the mouse and it will show hypnograms at the top of the page. (Note - a glitch not yet fixed means the alignments can be slightly off, however, in terms of which individuals are shown; if the rows are sorted, they should be representative of hypnograms in/near that region however.).
To look at one individual in more detail, go to the lower-left panel and select that person:
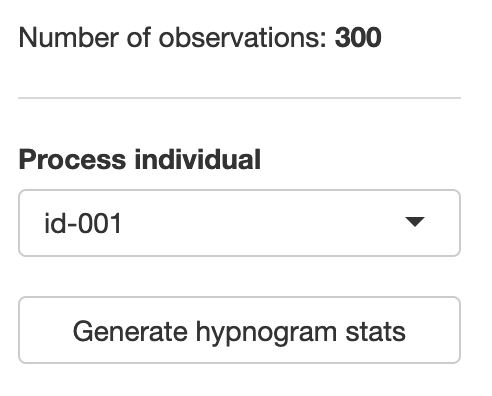
Clicking Generate hypnogram stats will pass the hypnogram for that person to the N=1 panel, in which the hypnogram statistics are then calculated.
Large studies
For studies with more observations than fit into the single window, the page will let you scroll up and down. Alternatively, you can right click and Open Image in New Tab (or similar, depending on your browser) or save it to a file, to view a zoomed-out version. Naturally the details of individual studies will be lost if there are more recordings than pixels on the screen: given appropriate sorting/filtering, the any marked global patterns should still be visible.
For smaller studies, Hypnoscope will expand the height of each bar to fill more of the display.
Known issues
-
resolving early/late start time
-
the mouse-over to select individual hypnograms from the main N>1 plot may be slightly miscalibrated
-
this issue will be fixed, but currently, ensure that any covariate file contains observations for all individuals in the
.hypnosfile
Access
See these notes on how to access Hypnoscope directly, e.g. to run locally rather than use the instance at http://remnrem.net/.
Inputs
Single hypnograms
In individual hypnogram N=1 mode, Hypnoscope accepts the same formats as Luna to represent sleep staging annotations. General annotation file formats are described here. Sleep stage conventions are described here.
The simplest format is .eannot - a basic plaintext file with one
label per line for each (30-second) epoch, using stage labels: N1
N2 N3 R W L and ?. This format does not contain any
clock-time information: Hypnoscope will arbitrarily set the recording
start to midnight.
Alternatively, .annot and .XML formats are supported (see the
above links for details), which can contain clock-time
information. The Luna tutorial data contains
examples of XML annotation files the specify sleep stage information.
Multiple hypnograms
To run in multiple hypnogram N>1 mode, you need to make a ".hypnos" file beforehand. Hypnoscope expects a single file with staging information for multiple individuals, one line per individual/epoch. As well as a stage label, this file must contain the clock time of each epoch, as this will be used to align stages between different individuals.
Gapped recordings
Currently, Hypnoscope does not support staging that contains gaps or variable epochs durations other than 30 seconds, although this constraint may be relaxed in future releases.
The input data for the N>1 mode should be a tab-delimited file with either 4 or 5 columns, with the latter format including sleep cycle information:
-
4-column format: ID, epoch, time, stage
-
5-column format: ID, epoch, time, cycle, stage
For example, some data in the 4-column format:
 ID     E     CLOCK_TIME    STAGE
 id1    1     23:23:02      W
 id1    2     23:23:32      W
 id1    3     23:24:02      N1
 ...
 id2    1     20:07:00      W
 id2    2     20:07:30      W
 ...
Specifically,
-
each row is one epoch for one individual
-
the first column must be
ID(individual identifier) -
the second colum must be
E(epoch count, always starting at epoch 1) -
the entire file should have either 4 or 5 tab-delimited columns for all rows
-
if four columns: the third column should be clock-time and the fourth should be stage; these columns can have any label however (e.g.
TimeorCLOCK_TIMEetc). That is, the information is specified by column position rather than variable name -
if five columns: columns three through five are clock-time, cycle and stage respectively; as above, columns three onwards can have any variable name in the header
-
clock-times should be 24-hour format, encoded as
hh:mm:ss -
valid stages labels are
N1N2N3RWas well asL(lights on) and?(unknown) -
alternatively,
NREM1NREM2NREM3REMandwakecan be used (also withUinstead of?) -
sleep cycle number should be
1,2etc if the epoch belongs to the first, second, etc cycle; if an epoch is not assigned to a cycle, it should beNA,.or0
By convention, these files should be saved with a .hypnos extension
(or .hypnos.gz if gzip-compressed) but it can also have a .txt extension.
Covariates
In N>1 mode, you can attach extra covariate information which can be used to set the row order of hypnograms (i.e. sorting the rows of the individual by epoch matrix). The Example dataset includes a set of covariates previously calculated for those individuals.
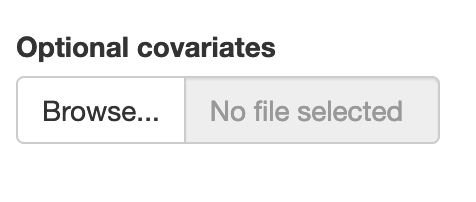
To attach a new set, click on the Optional covariates form:
Covariate files should be plaintext
-
tab-delimited
-
IDas the first field and header column (individual identifier) -
all subsequent rows contain arbitrary numeric data
-
missing values should be encoded
NAor.
The Covariates panel will show a table after a covariate file has been attached:
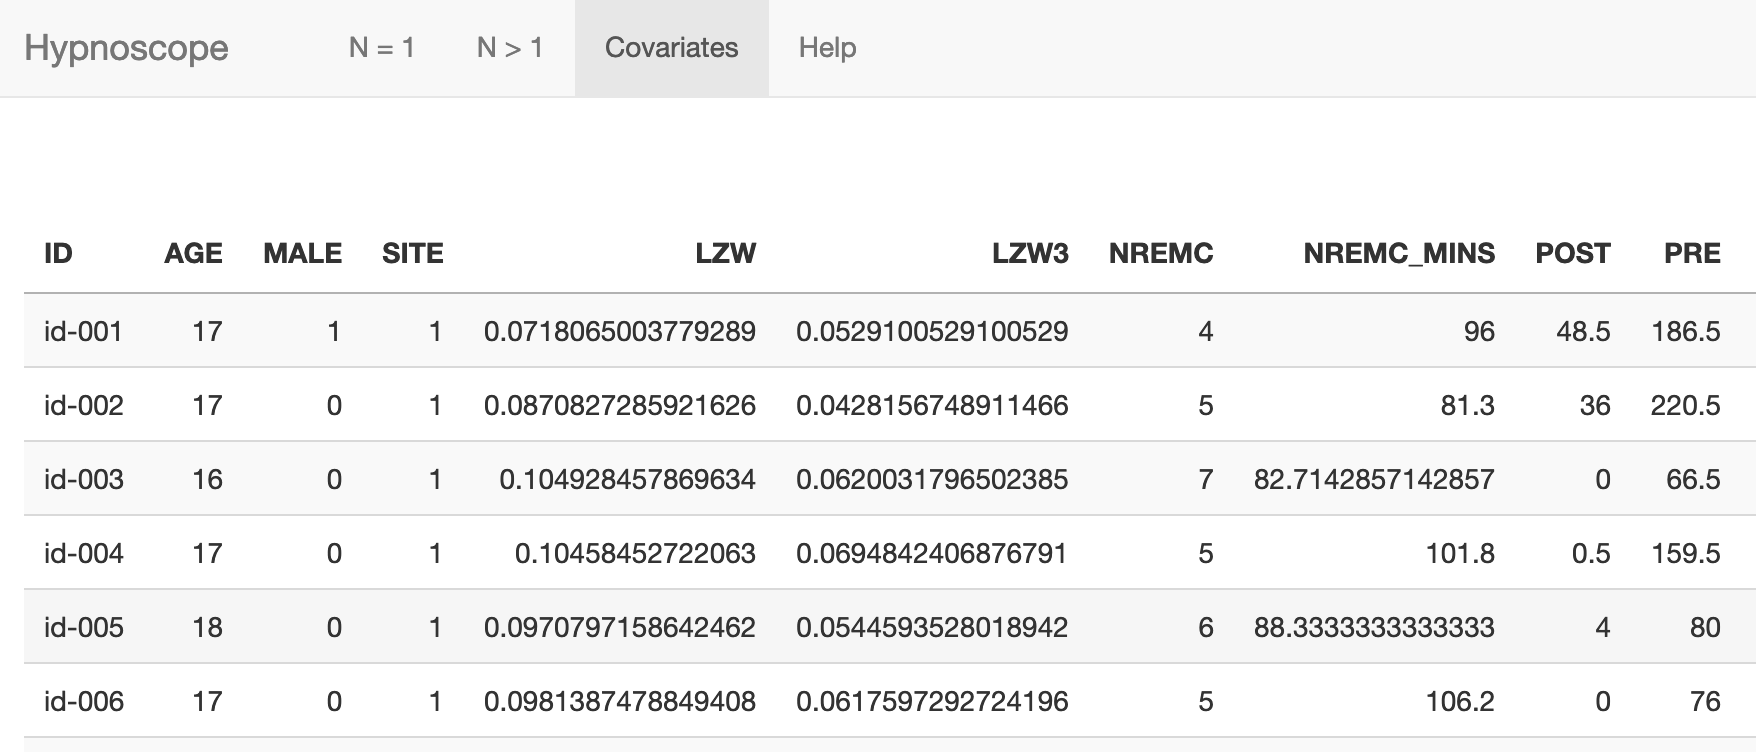
In the example dataset, as well as some basic demographics (age, sex)
the covariate file contains a set of metrics calculated based on the
hypnogram data themselves (i.e. from Luna's HYPNO command). This
will be a common scenario, i.e. to enable sorting the rows by relevant
features such as total sleep time (TST) or other measures. The
covariates can be any feature however (e.g. disease groups), but
should be encoded numerically.
Making .hypnos files
To use Luna to generate a .hypnos file: assuming a sample list s.lst that contains
annotations with stage data:
luna s.lst -o out.db -s HYPNO epoch
then extract the epoch-level outputs (here including NREM cycle number also):
destrat out.db +HYPNO -r E -v CLOCK_TIME CYCLE OSTAGE > data.hypnos
Original staging
Note that above we extract OSTAGE
(original stage) rather than STAGE, as the latter may be
slightly editted by Luna (e.g. setting lights out for
leading/trailing epochs, or setting some epochs to ? if they
imply excessive WASO (e.g. a single sleep epoch followed by
several hours of wake before the main sleep period). Either
variable can be used for Hypnoscope.
If CYCLE is dropped above, a 4-column dataset is exported (i.e. no
cycle information). Note that destrat outputs variables in
alphabetical order, thus clock-time, cycle and stage
information, as required by Hypnoscope.
To output a compressed file:
destrat out.db +HYPNO -r E -v CLOCK_TIME CYCLE OSTAGE | gzip > data.hypnos.gz